Fig. A.3
Download original image
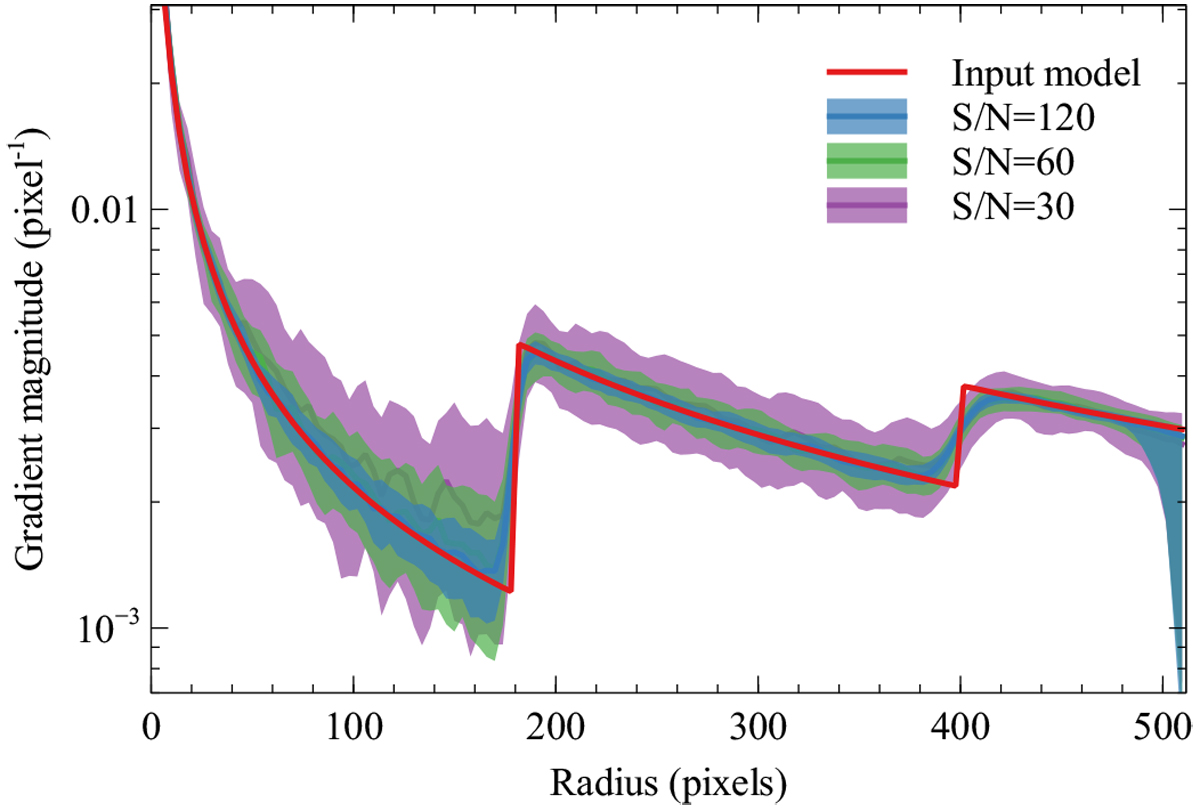
Comparison of the input and recovered gradient magnitudes. The gradient of the input model is plotted in 128 radial bins. The shaded regions show the median and 1σ percentiles of the pixels in each radial bin from recovered gradient maps. The S/N = 30 results are taken from A.2. Also shown is the effect of increasing the signal to noise ratio of the input image and smoothing by factors of 2 and 4.
Current usage metrics show cumulative count of Article Views (full-text article views including HTML views, PDF and ePub downloads, according to the available data) and Abstracts Views on Vision4Press platform.
Data correspond to usage on the plateform after 2015. The current usage metrics is available 48-96 hours after online publication and is updated daily on week days.
Initial download of the metrics may take a while.