Fig. 19
Download original image
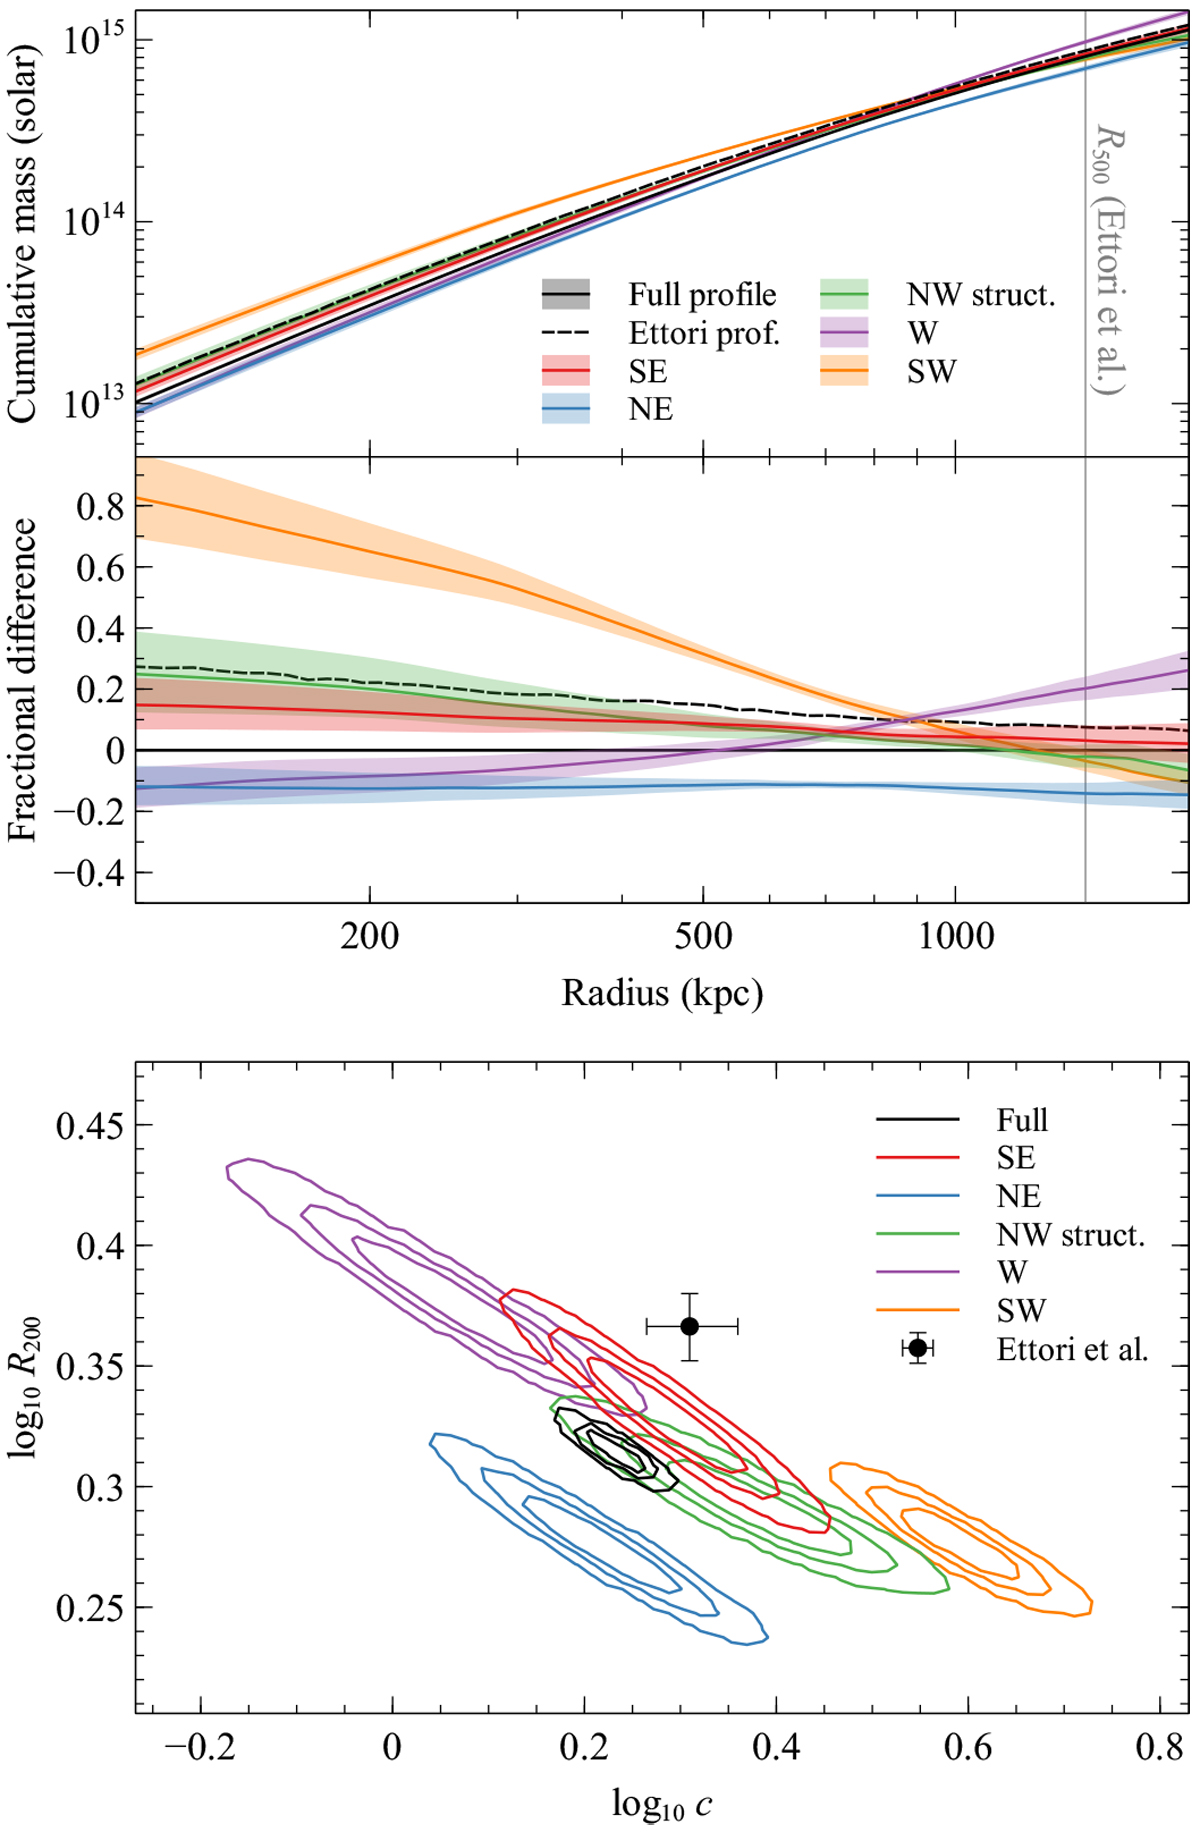
Obtained hydrostatic mass profiles and parameters. The top panel shows the mass profiles in different sectors and for the full cluster, compared to the results from Ettori et al. (2019). Below that is shown the fractional difference between each profile and the full profile. In the bottom panel, the posterior probability contours for the concentration log10 c and radius log10 R200, are shown, with levels containing 68, 90, and 99% of the values. The Ettori et al. (2019) point is plotted assuming radius and concentration are independent.
Current usage metrics show cumulative count of Article Views (full-text article views including HTML views, PDF and ePub downloads, according to the available data) and Abstracts Views on Vision4Press platform.
Data correspond to usage on the plateform after 2015. The current usage metrics is available 48-96 hours after online publication and is updated daily on week days.
Initial download of the metrics may take a while.