Fig. 14
Download original image
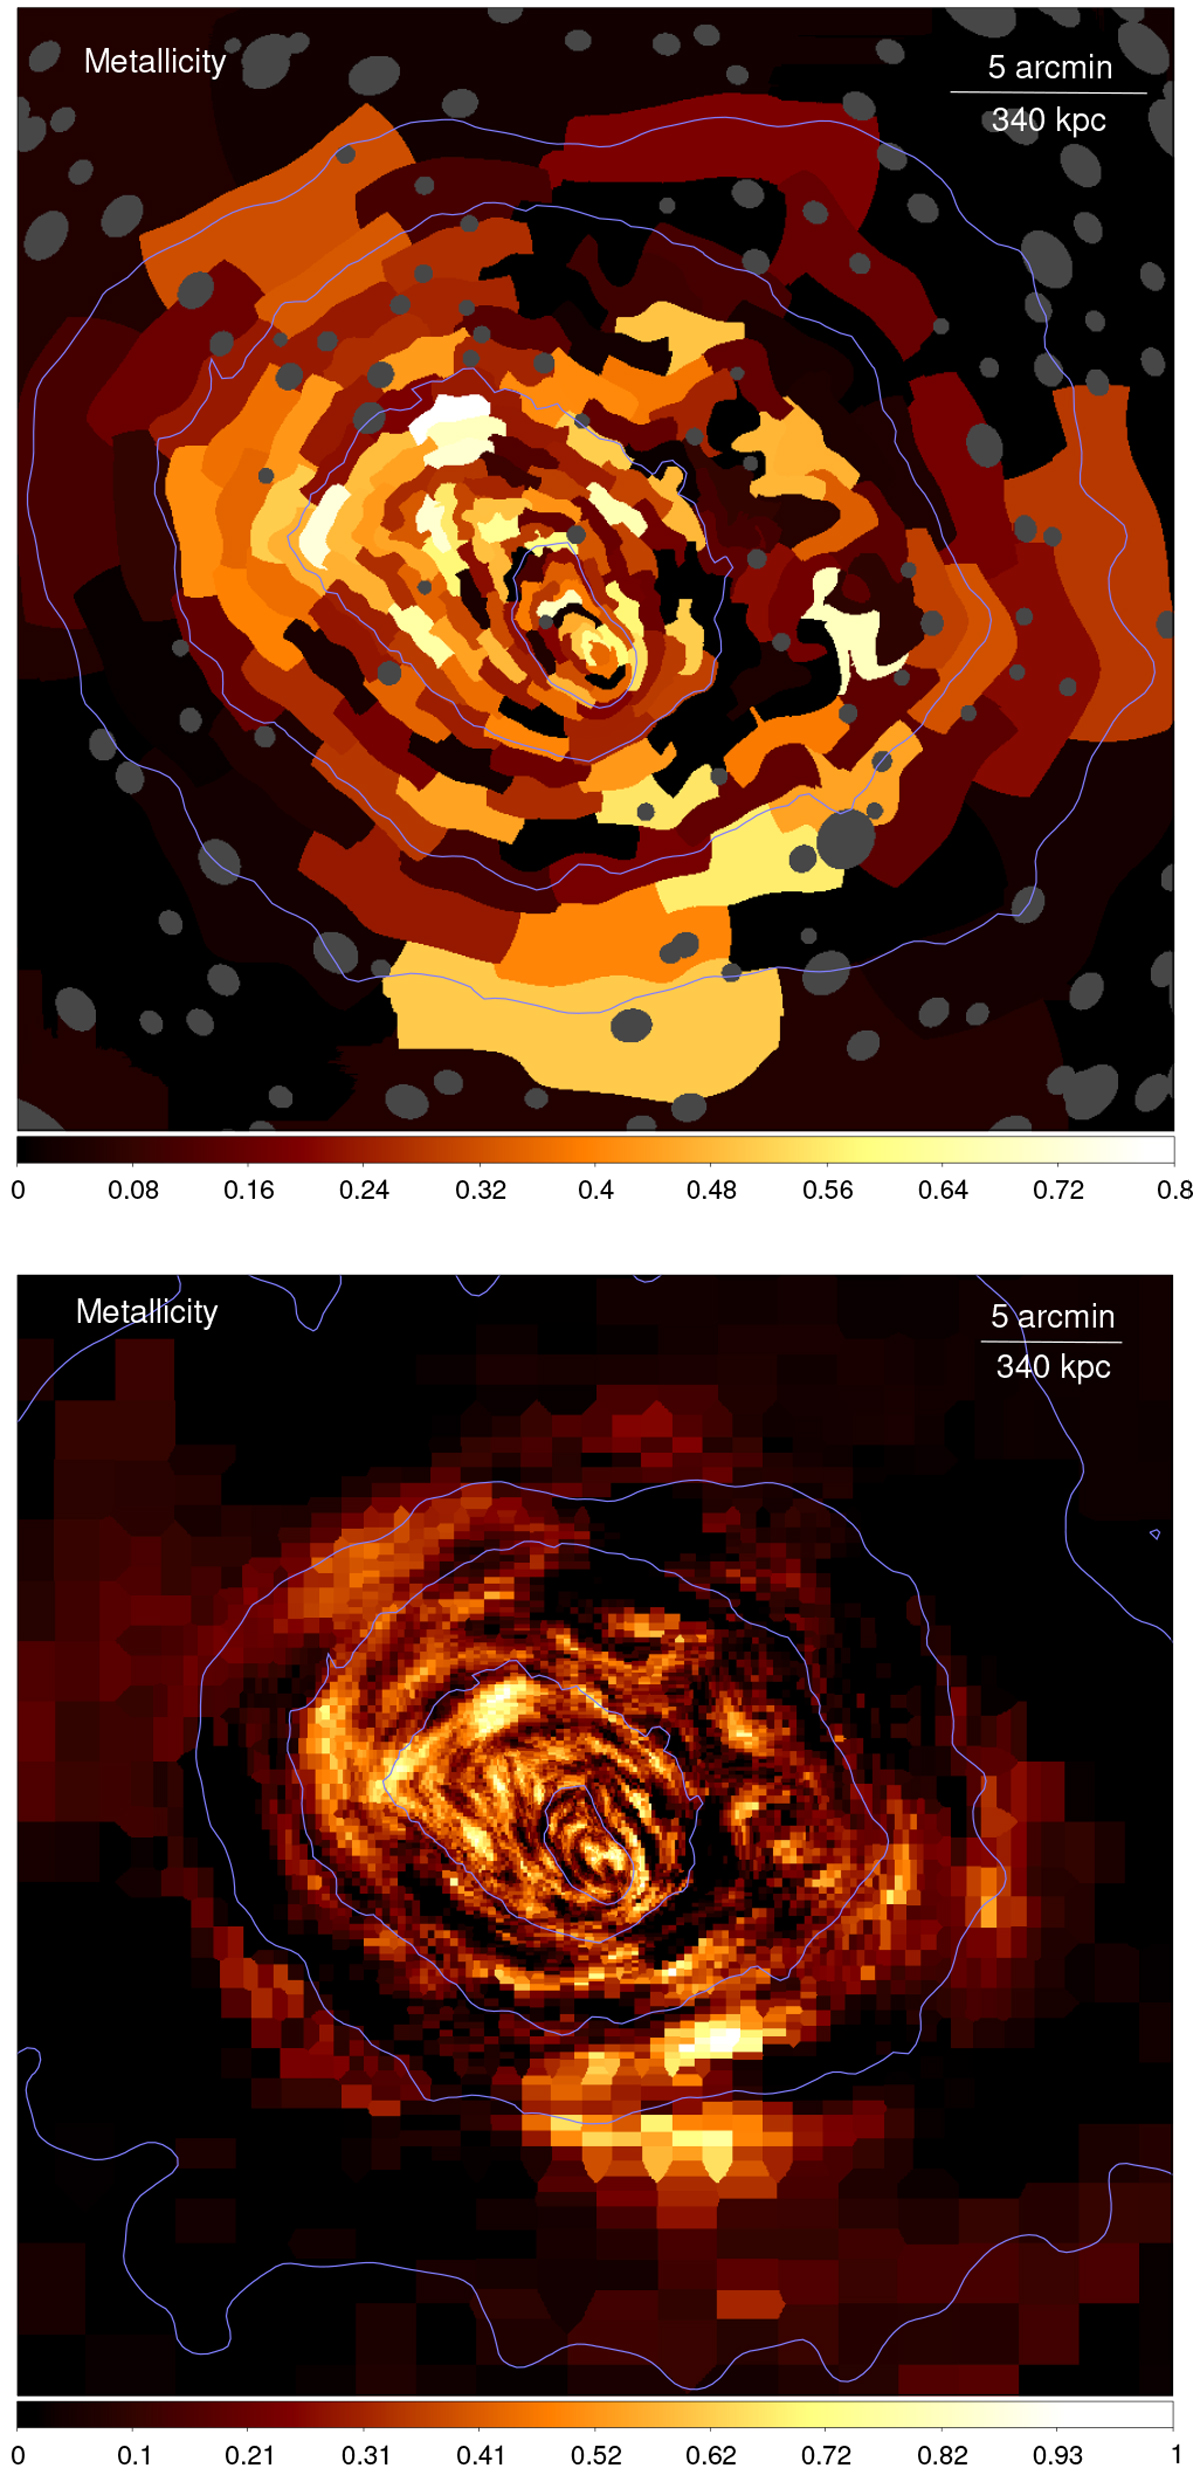
Metallicity maps of the cluster made using the contour binning (top) and ellipse (bottom) methods. The maps were created using spectra extracted from regions with a signal to noise ratio of 100. Typical statistical uncertainties are 0.17 Z⊙.
Current usage metrics show cumulative count of Article Views (full-text article views including HTML views, PDF and ePub downloads, according to the available data) and Abstracts Views on Vision4Press platform.
Data correspond to usage on the plateform after 2015. The current usage metrics is available 48-96 hours after online publication and is updated daily on week days.
Initial download of the metrics may take a while.