Fig. 13
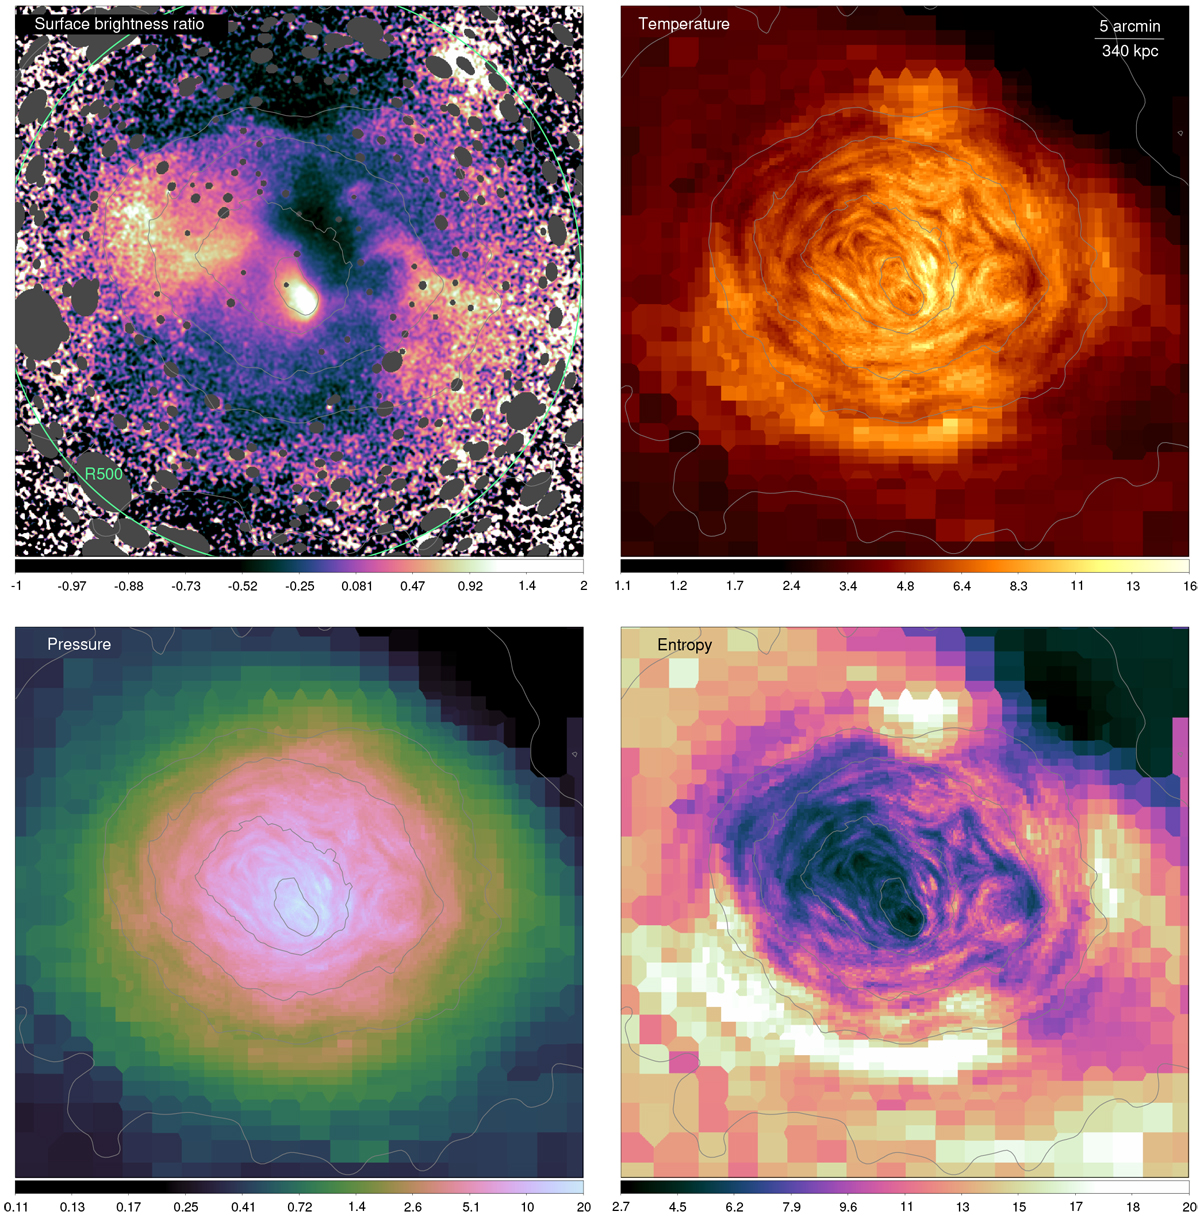
Download original image
Spatially resolved spectroscopic maps made using the ellipse fitting method. These use the same signal to noise ratio as the contour binned maps in Fig. 12 but are zoomed to show a larger area and have slightly different colour scales. The ratio map in this case has been smoothed by a Gaussian with σ = 6 arcsec. The ellipses selected have a similar area to the contour binning regions shown in Fig. 12 and have a similar aspect ratio, with many having the maximum 3:1 ratio.
Current usage metrics show cumulative count of Article Views (full-text article views including HTML views, PDF and ePub downloads, according to the available data) and Abstracts Views on Vision4Press platform.
Data correspond to usage on the plateform after 2015. The current usage metrics is available 48-96 hours after online publication and is updated daily on week days.
Initial download of the metrics may take a while.