Fig. 11

Download original image
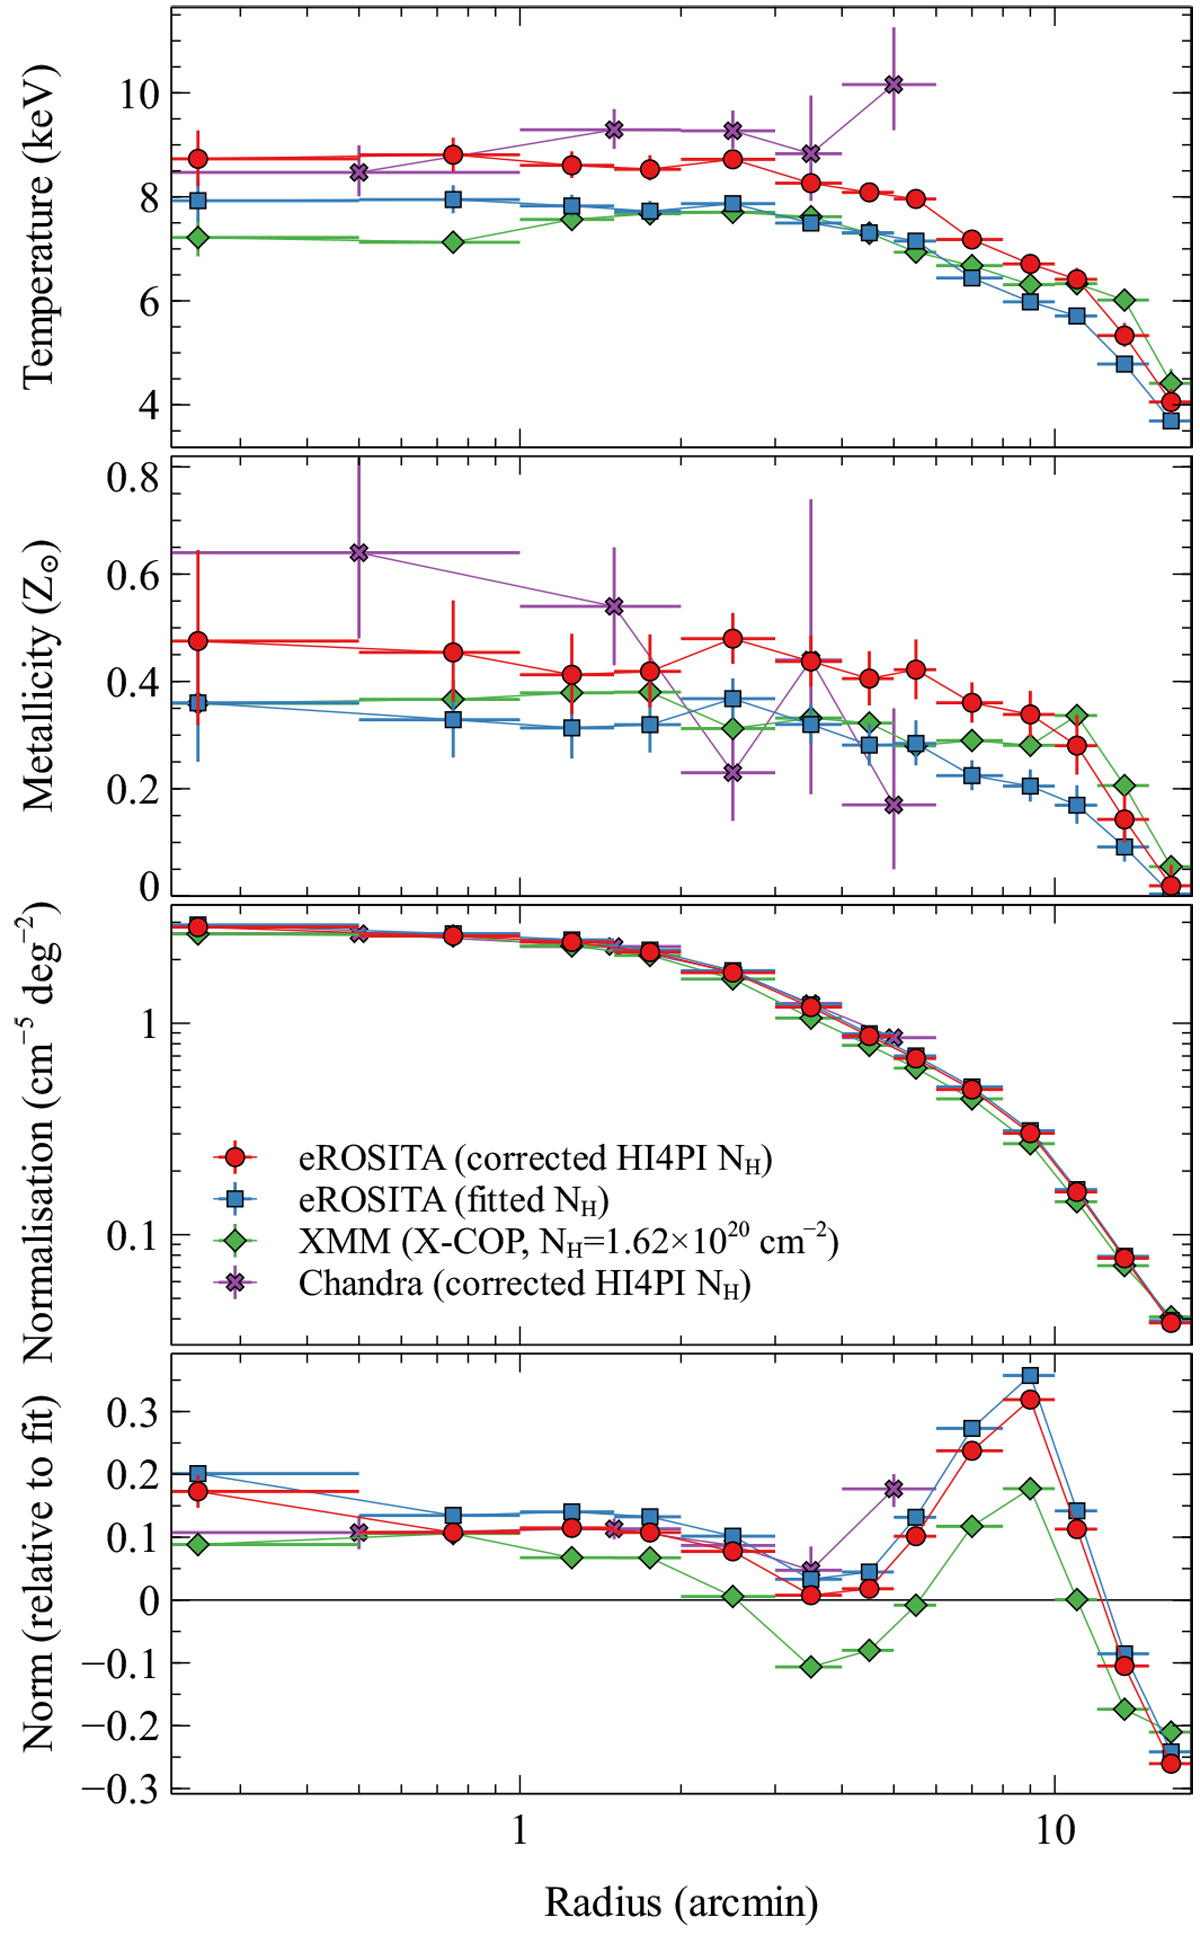
Comparison between eROSITA, XMM-Newton, and Chandra spectroscopic profiles for annular regions, showing the temperature, metallicity, normalisation, and relative normalisation. The XMM-Newton results are the from the X-COP analysis of Ghirardini et al. (2019), scaling the metallicity profiles from Anders & Grevesse (1989) to Asplund et al. (2009) solar abundance ratios by multiplying by a factor of 1.48 to account for the relative H/Fe ratio. The eROSITA profiles use the same centre and annuli as the XMM-Newton profiles, while the Chandra profiles use wider annuli. Normalisations are the Xspec normalisation factor per square degree. The relative normalisation shows the fractional difference to a β-model fitted to the XMM-Newton data.
Current usage metrics show cumulative count of Article Views (full-text article views including HTML views, PDF and ePub downloads, according to the available data) and Abstracts Views on Vision4Press platform.
Data correspond to usage on the plateform after 2015. The current usage metrics is available 48-96 hours after online publication and is updated daily on week days.
Initial download of the metrics may take a while.


