Fig. 9
Download original image
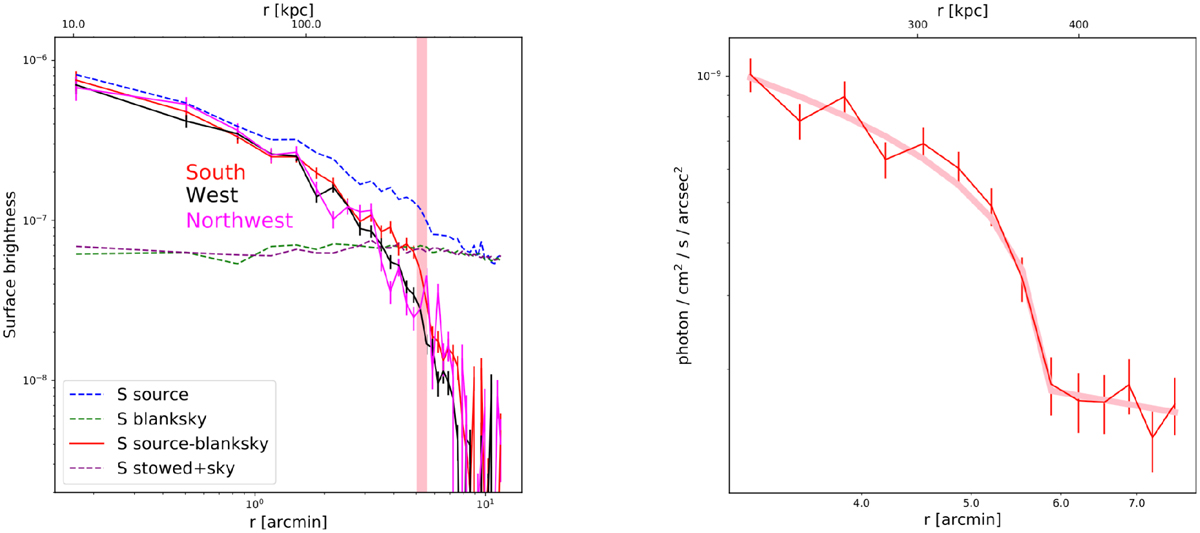
Left: Blanksky background subtracted surface brightness profiles of the south (red), west (west), and northwest (magenta) directions in units of counts s–1 arcsec–2 as measured with Chandra. The level of the tailored blanksky background (green dashed) and that of the stowed background plus the astrophysical background (purple dashed) for the south direction are consistent. The blue dashed line represents the total emission from both the source and background of the south direction. The vertical pink line marks the position of a possible density jump in the south direction. Right: surface brightness profile zoomed in around the surface brightness edge in the south direction in units of photons–1 cm–2 arcsec–2. We fit the data with a broken powerlaw density model (pink) and obtain a best-fit density jump of 1.45.
Current usage metrics show cumulative count of Article Views (full-text article views including HTML views, PDF and ePub downloads, according to the available data) and Abstracts Views on Vision4Press platform.
Data correspond to usage on the plateform after 2015. The current usage metrics is available 48-96 hours after online publication and is updated daily on week days.
Initial download of the metrics may take a while.