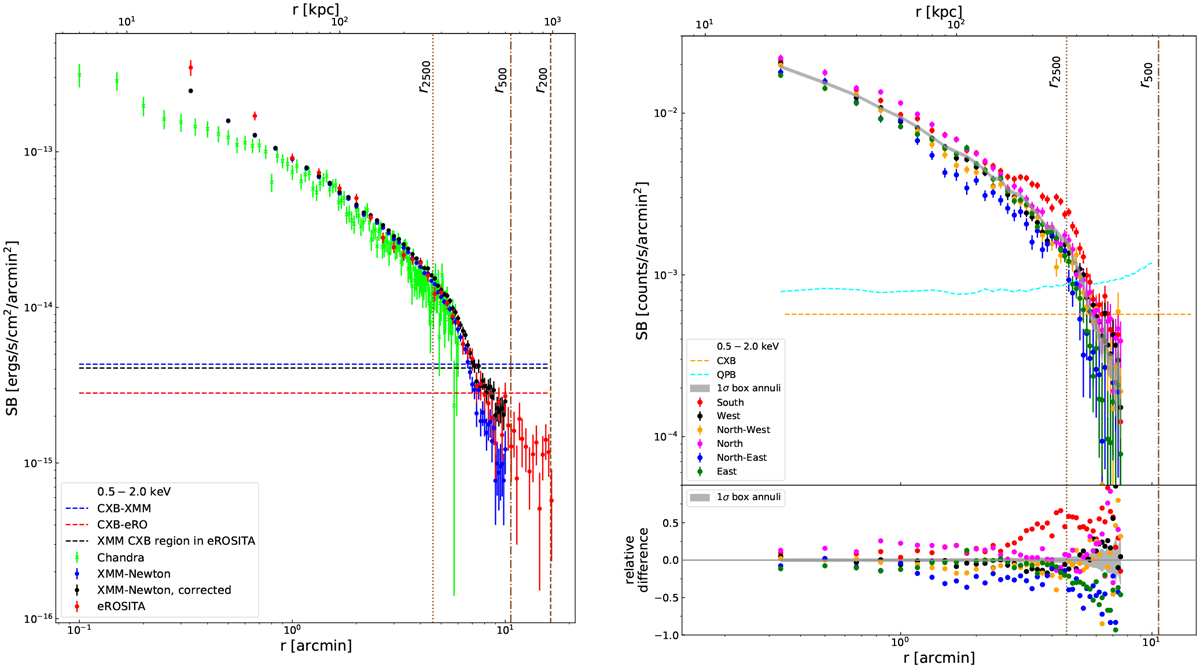
Fig. 8
Download original image
Left: instrument independent, absorption corrected, and background subtracted sX profiles of Chandra (green), XMM-Newton (blue), and eROSITA (red) in the energy band 0.5–2.0 keV. The blue, red, and black horizontal dashed lines are the CXB levels of XMM-Newton, eROSITA, and eROSITA with XMM-Newton defined CXB region, respectively. Black points are the CXB corrected XMM-Newton sX. The various radii are plotted in brown. Right: XMM-Newton Sx profiles in different directions of the Northern Clump using the box annuli setup (top) and the relative differences with respect to the average surface brightness (bottom). The grey shaded areas in both plots are the lσ confidence region of the average Sx The various radii are plotted in brown. The CXB and QPB level are plotted in orange and cyan dashed lines.
Current usage metrics show cumulative count of Article Views (full-text article views including HTML views, PDF and ePub downloads, according to the available data) and Abstracts Views on Vision4Press platform.
Data correspond to usage on the plateform after 2015. The current usage metrics is available 48-96 hours after online publication and is updated daily on week days.
Initial download of the metrics may take a while.