Fig. 7
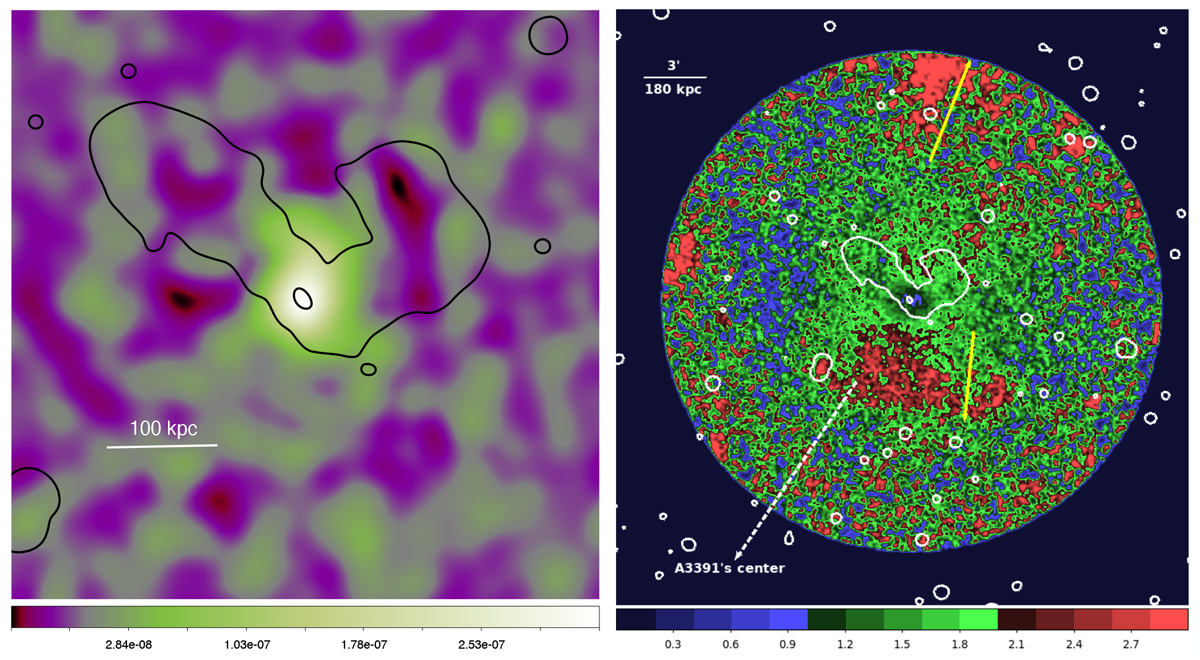
Download original image
Left: Chandra unsharp masked image of the central region of the Northern Clump. Right: XMM-Newton residual image. The northern yellow arrow shows the 5.3′ projected length of the tail emission. The enhancement in the south is indicated by the southern yellow arrow and the center of A339l cluster is pointed by the dashed-line white arrow. Gaussian smoothing with kernel radius of 3 pixels is applied to the image. Black and white contours in both images represent the ASKAP/EMU radio continuum emission.
Current usage metrics show cumulative count of Article Views (full-text article views including HTML views, PDF and ePub downloads, according to the available data) and Abstracts Views on Vision4Press platform.
Data correspond to usage on the plateform after 2015. The current usage metrics is available 48-96 hours after online publication and is updated daily on week days.
Initial download of the metrics may take a while.