Fig. 6
Download original image
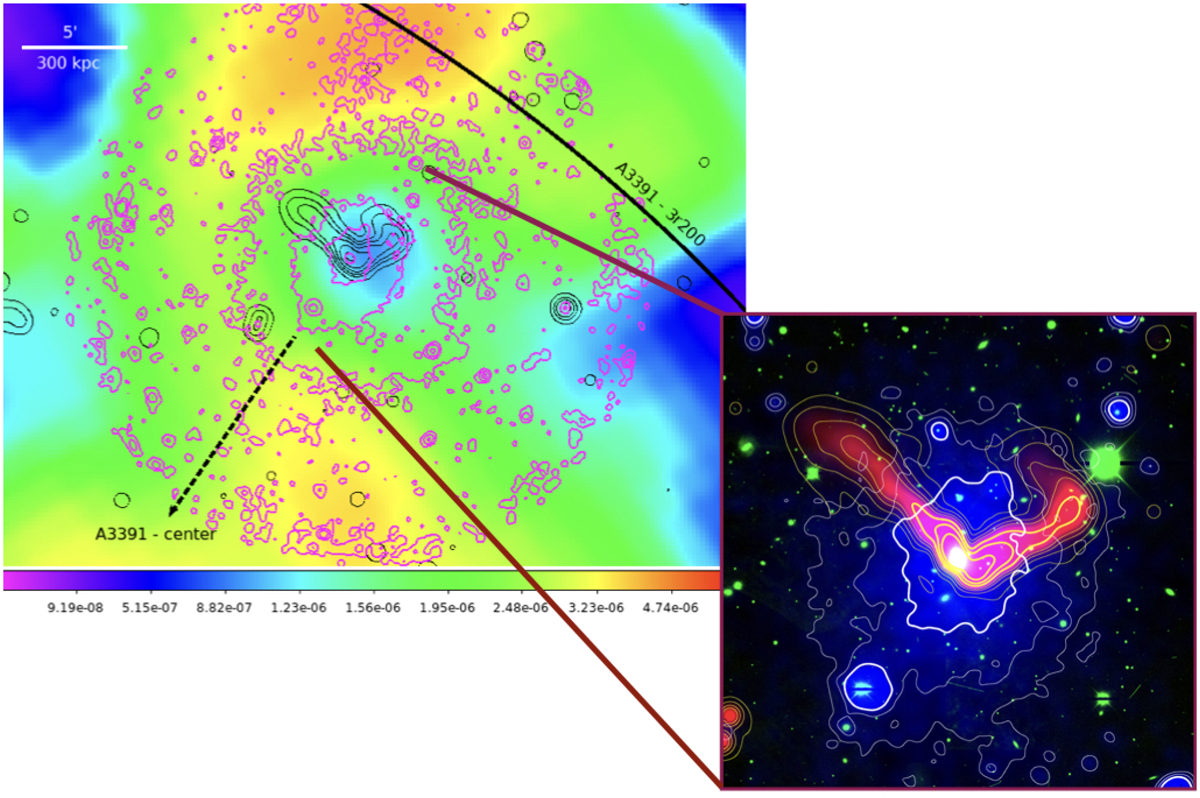
Left: Planck y-map overlaid with X-ray (from XMM-Newton, in magenta) and radio (ASKAP/EMU, in black) contours. Black line depicts the 3 × R200 of A3391 and black dashed-line points toward the center of A3391. Right: radio+X-ray+optical composite image of the central region of the Northern Clump. The image is generated utilizing ASKAP/EMU image (red color and yellow contour), XMM-Newton image (blue color and white contour), and DECam Sloan g-band image (green color).
Current usage metrics show cumulative count of Article Views (full-text article views including HTML views, PDF and ePub downloads, according to the available data) and Abstracts Views on Vision4Press platform.
Data correspond to usage on the plateform after 2015. The current usage metrics is available 48-96 hours after online publication and is updated daily on week days.
Initial download of the metrics may take a while.