Fig. 3
Download original image
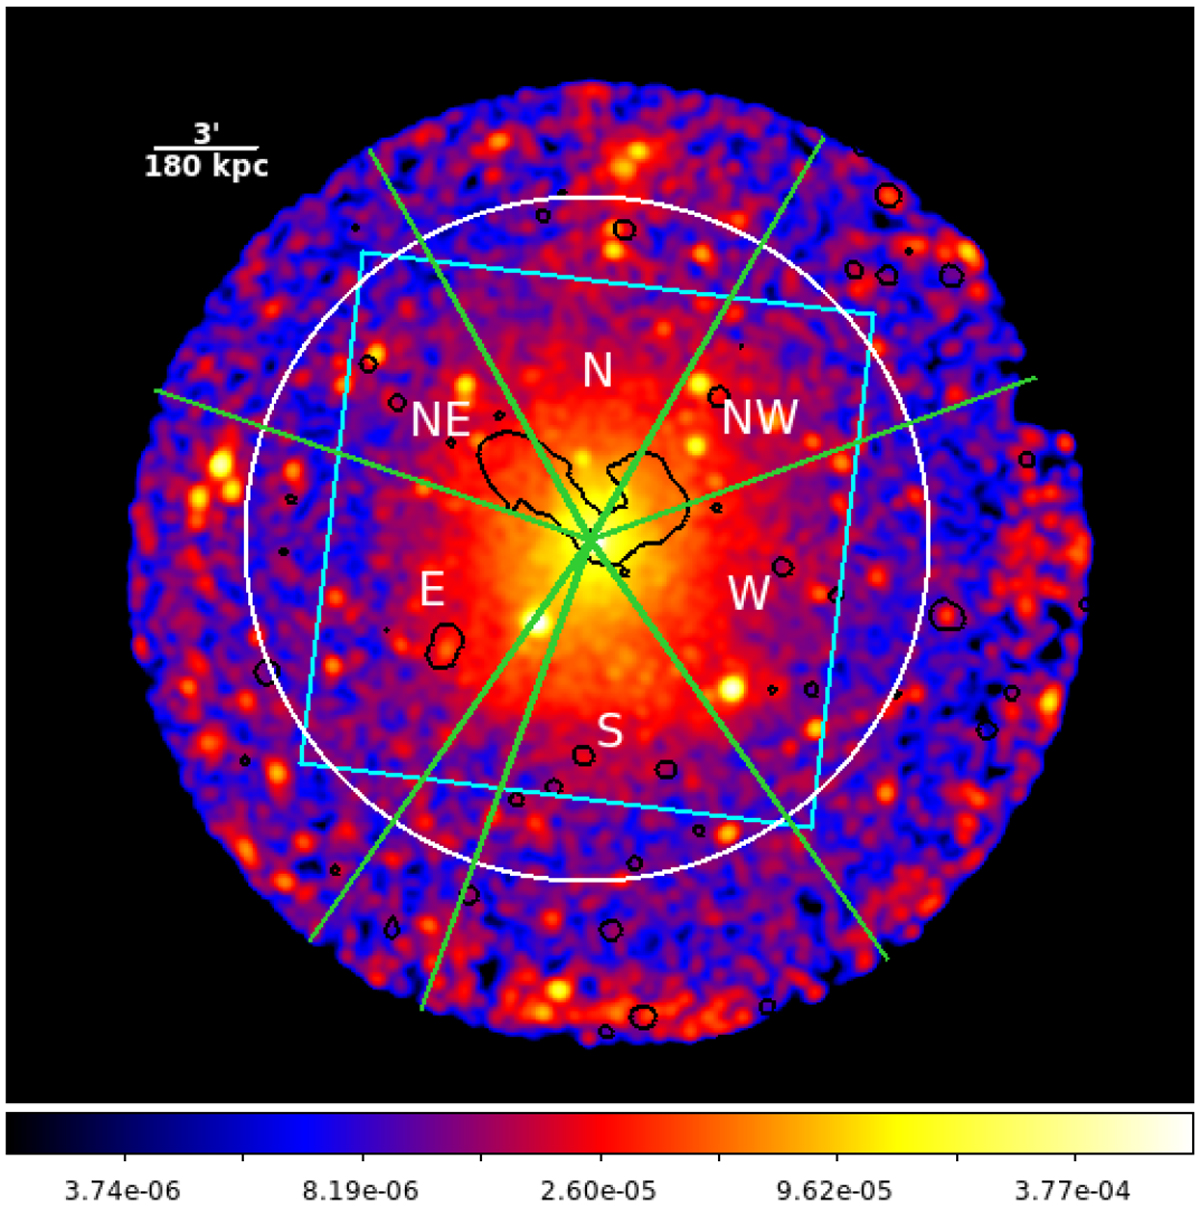
XMM-Newton count rate image of the Northern Clump in the energy band 0.5–2.0 keV, overlaid with the ASKAP/EMU radio contour (black). The anomalous CCD chips are removed and the QPB is subtracted from the image. The sectors are south (S), west (W), northwest (NW), north (N), northeast (NE), and east (E). The white circle and cyan square depict the outermost annuli of corresponding setups. The radius of the circle is 10′ and the half-width of the square is 7.5′. Gaussian smoothing with kernel radius of 7 pixels is applied to the image.
Current usage metrics show cumulative count of Article Views (full-text article views including HTML views, PDF and ePub downloads, according to the available data) and Abstracts Views on Vision4Press platform.
Data correspond to usage on the plateform after 2015. The current usage metrics is available 48-96 hours after online publication and is updated daily on week days.
Initial download of the metrics may take a while.