Fig. D.3
Download original image
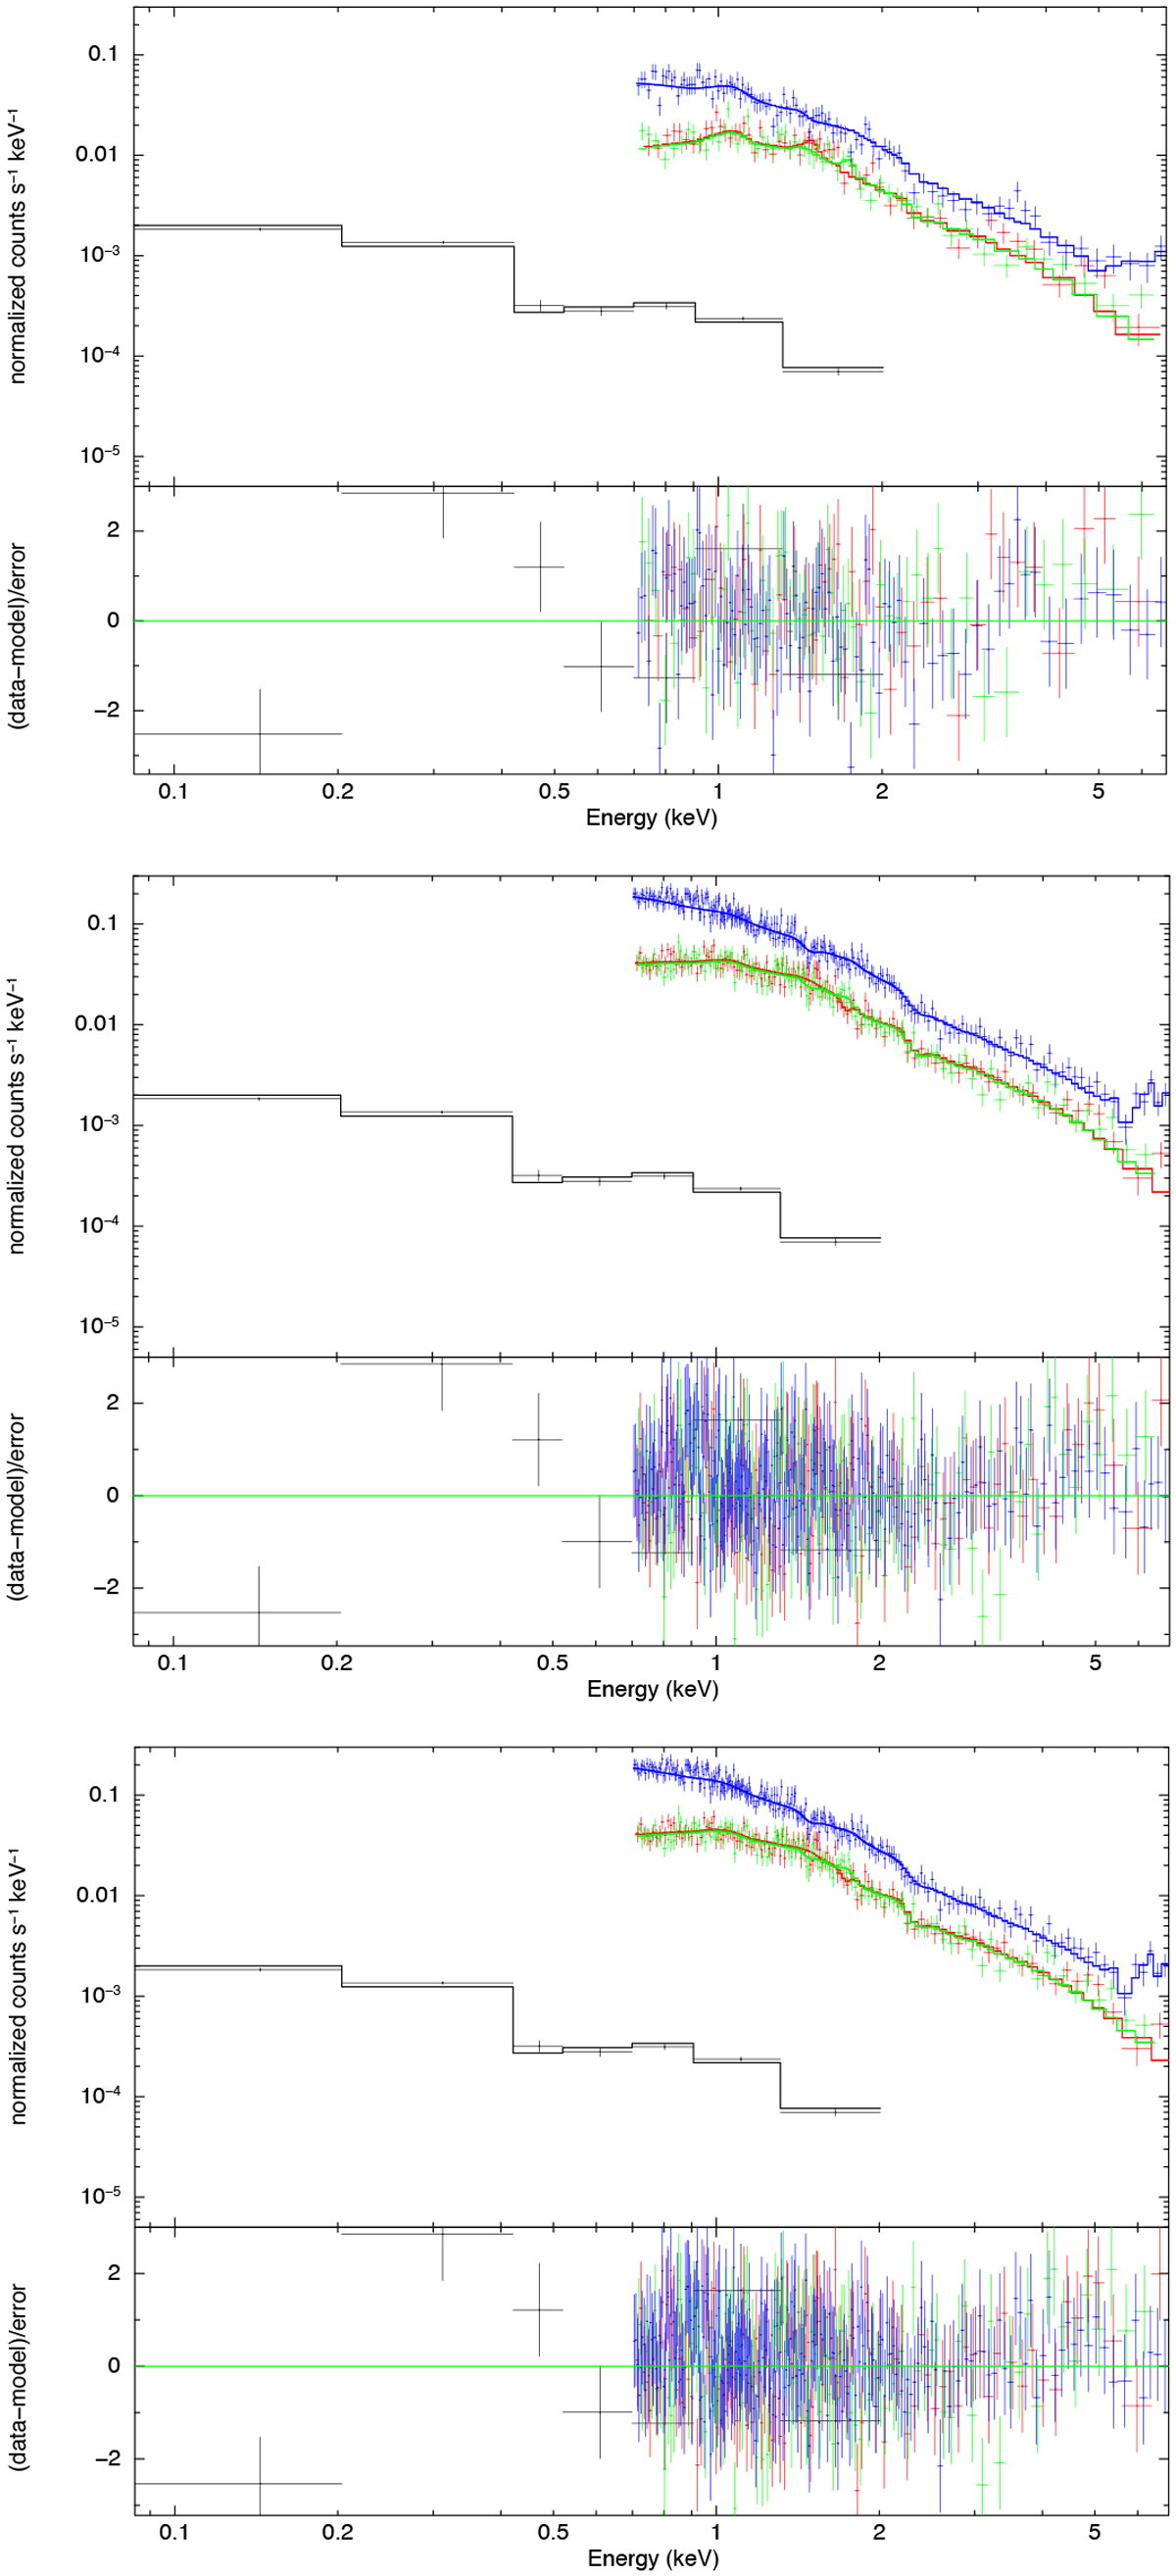
XMM-Newton and RASS background spectra (black) of the central bin fitted with the three different central AGN models in the energy range of 0.7–7.0 keV. Top: Method 1 - with 15′′ mask to mask the central AGN. Middle: Method 2 - AGN component is modeled from Chandra best fit values. Bottom: Method 3 - AGN is modeled and additional thermal component is added.
Current usage metrics show cumulative count of Article Views (full-text article views including HTML views, PDF and ePub downloads, according to the available data) and Abstracts Views on Vision4Press platform.
Data correspond to usage on the plateform after 2015. The current usage metrics is available 48-96 hours after online publication and is updated daily on week days.
Initial download of the metrics may take a while.