Fig. D.1
Download original image
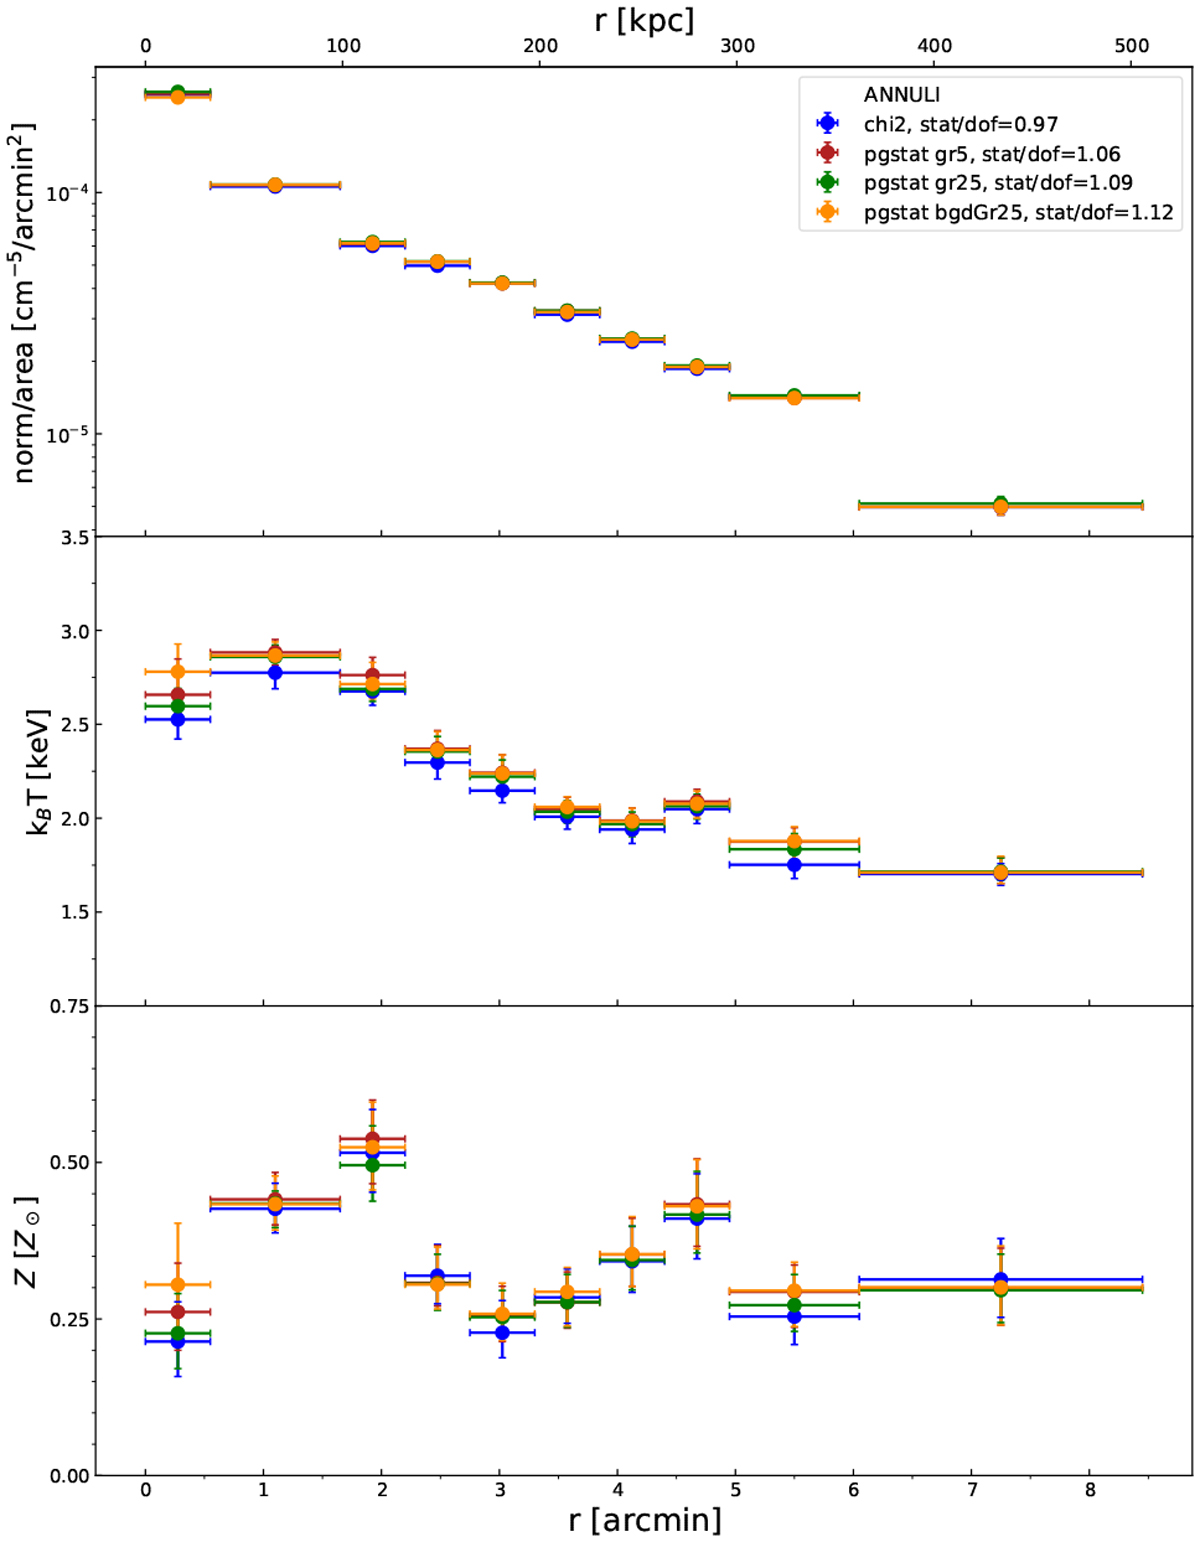
Normalization (top), temperature (middle), and metal-licity (bottom) profiles of the Northern Clump derived in the energy band 0.7–7.0 keV. Blue points are estimated using χ2-statistics, while the red, green, and orange points are estimated using pgstat statistic with source spectrum grouping 5, 25, and background spectrum grouping 25.
Current usage metrics show cumulative count of Article Views (full-text article views including HTML views, PDF and ePub downloads, according to the available data) and Abstracts Views on Vision4Press platform.
Data correspond to usage on the plateform after 2015. The current usage metrics is available 48-96 hours after online publication and is updated daily on week days.
Initial download of the metrics may take a while.