Fig. A.1
Download original image
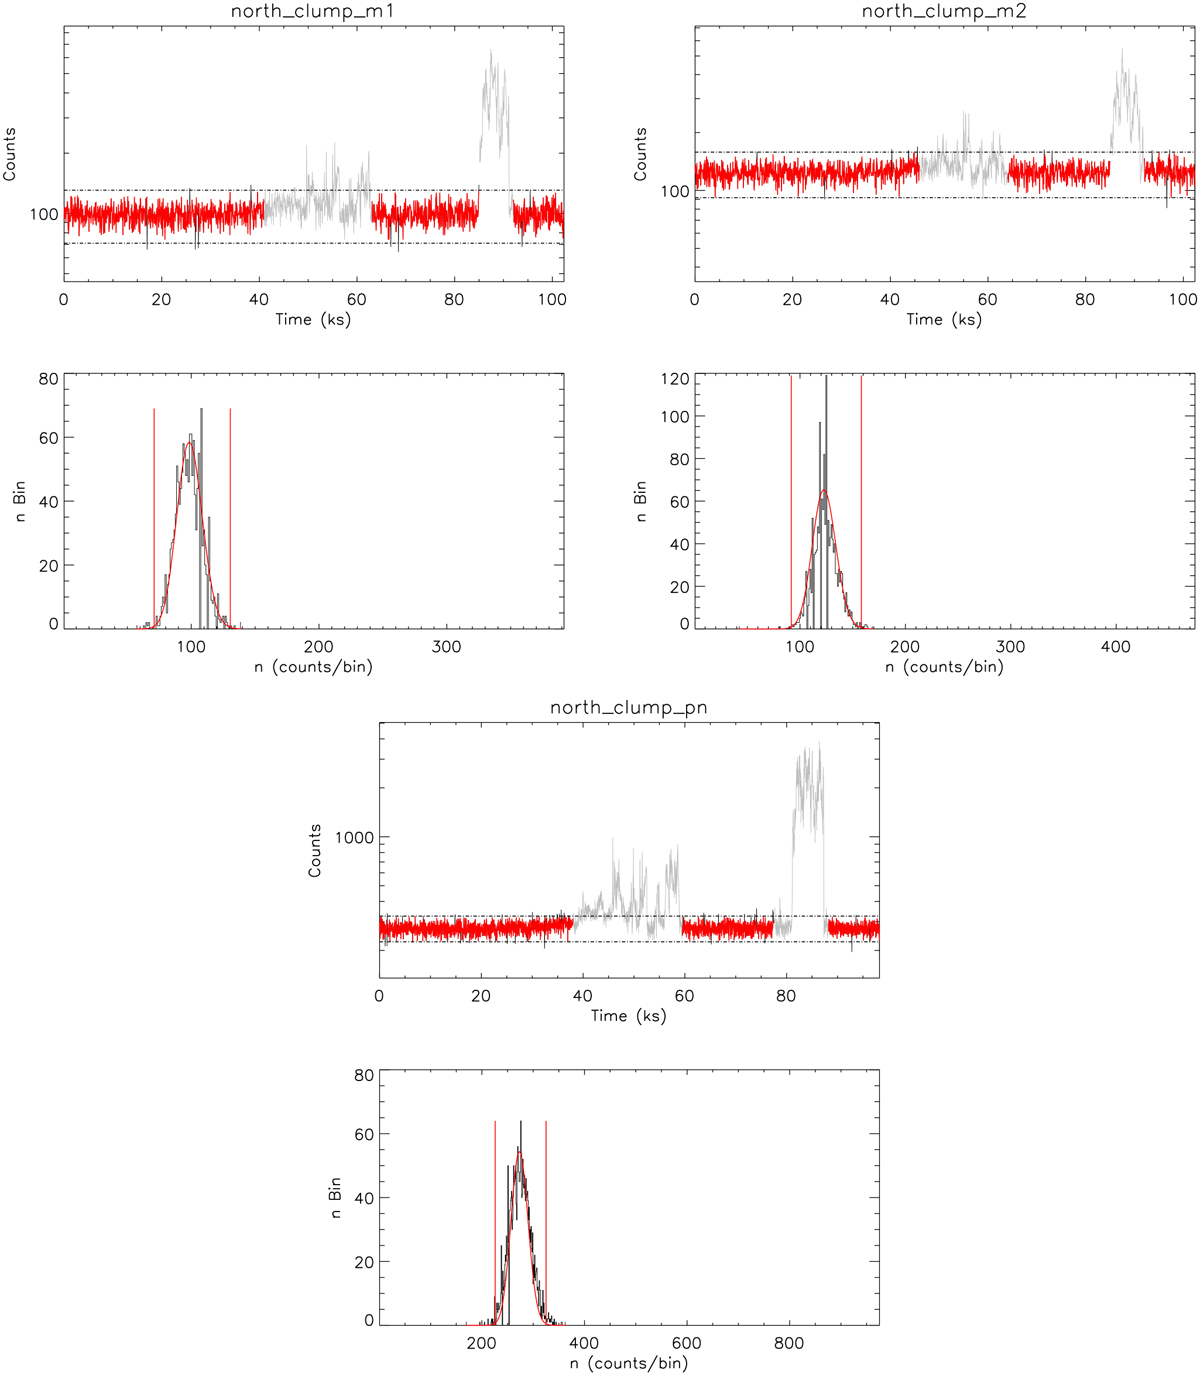
Top panels show the lightcurves of MOS1 (top left), MOS2 (top right), and pn (bottom) of the Northern Clump observation (ObsID: 0852980601). The red line depicts the accepted portion of the observation, while the grey is the rejected portion due to SPF. The dashed lines mark the 3σ. The bottom panels show the histograms of the associated lightcurves, fitted with Gaussian (red curve). The red vertical lines mark the 3σ.
Current usage metrics show cumulative count of Article Views (full-text article views including HTML views, PDF and ePub downloads, according to the available data) and Abstracts Views on Vision4Press platform.
Data correspond to usage on the plateform after 2015. The current usage metrics is available 48-96 hours after online publication and is updated daily on week days.
Initial download of the metrics may take a while.