Fig. 16
Download original image
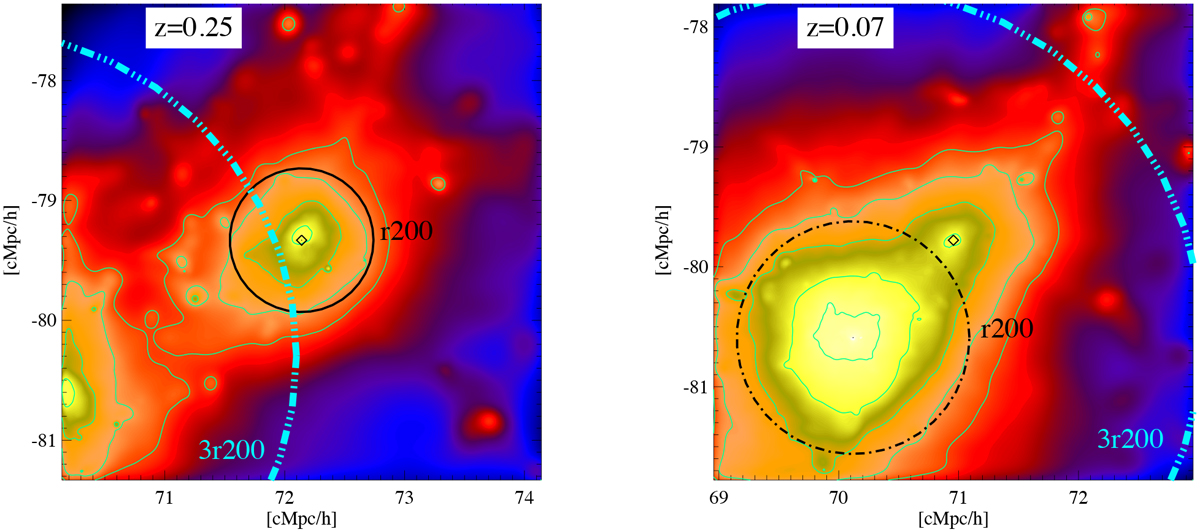
Simulated projected maps of gas surface density, centered on the infalling group B (black diamond marking its center), at z = 0.25 (left) and z = 0.07 (right). The gas surface density map encloses a comoving volume of (4 cMpc/h)3. In both panels, we mark the circles corresponding to three times the GC1 cluster virial radius ![]() and R200 of the group at z = 0.25 (solid) and of the GC1 cluster at z = 0.07 (dot-dashed; when group B is a substructure of GC1).
and R200 of the group at z = 0.25 (solid) and of the GC1 cluster at z = 0.07 (dot-dashed; when group B is a substructure of GC1).
Current usage metrics show cumulative count of Article Views (full-text article views including HTML views, PDF and ePub downloads, according to the available data) and Abstracts Views on Vision4Press platform.
Data correspond to usage on the plateform after 2015. The current usage metrics is available 48-96 hours after online publication and is updated daily on week days.
Initial download of the metrics may take a while.