Fig. 13
Download original image
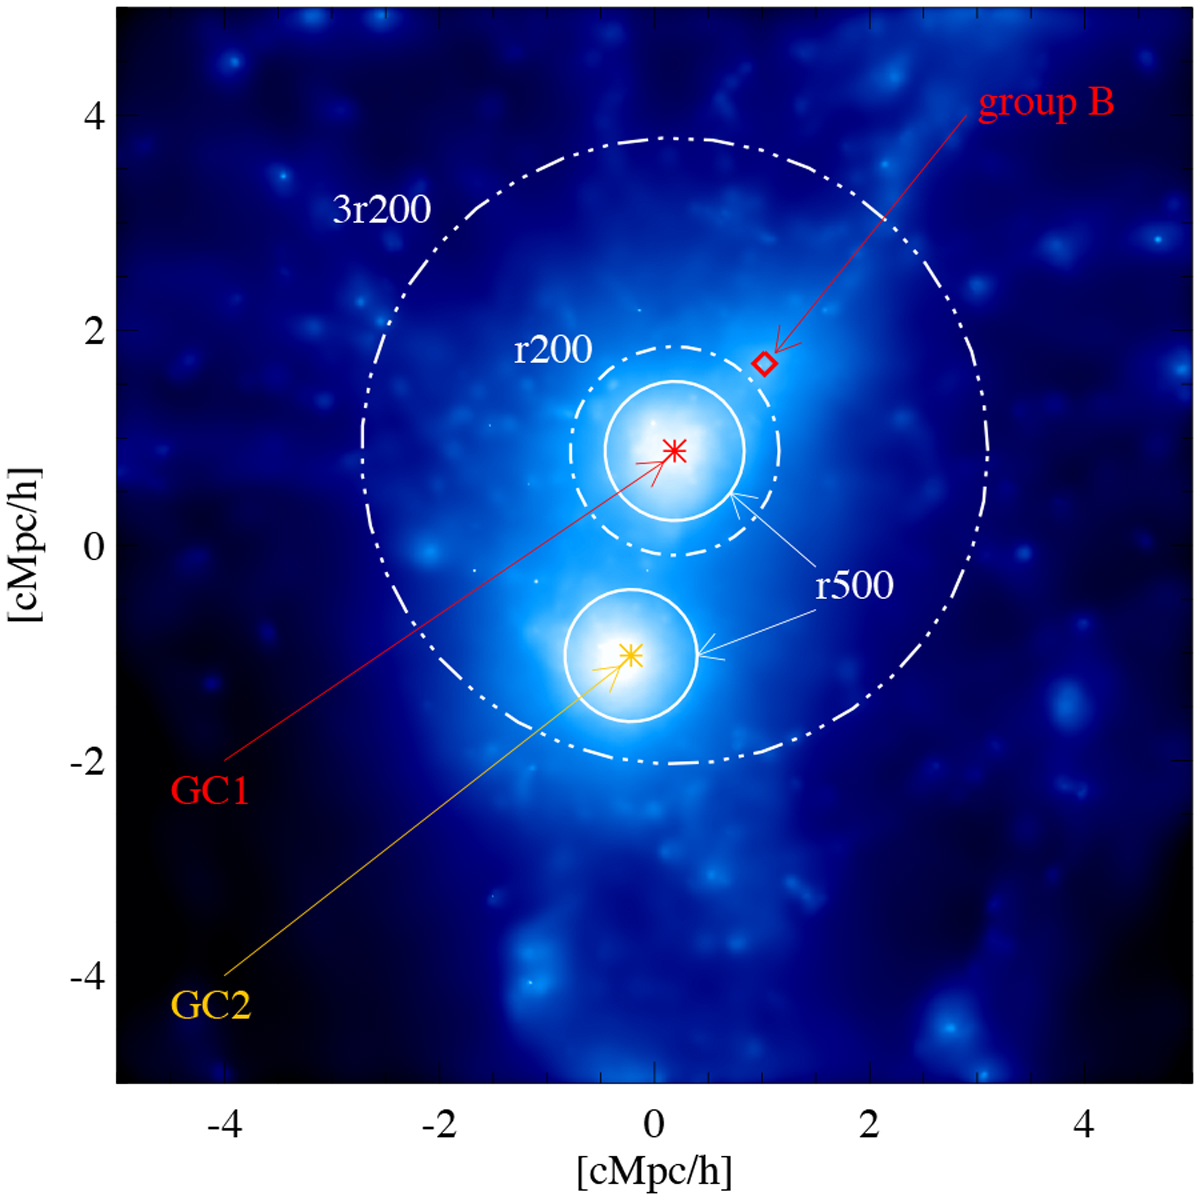
Gas density map of the A3391/95 analog pair from the Magneticum Simulation, at z = 0.07. The region shown comprises a cubic volume of 10 cMpc/h per side centered on the pair center of mass. The two main clusters GC1 and GC2 are marked, with their R200 and R500 (defined w.r.t. the critical density of the Universe), as well as the position of group B.
Current usage metrics show cumulative count of Article Views (full-text article views including HTML views, PDF and ePub downloads, according to the available data) and Abstracts Views on Vision4Press platform.
Data correspond to usage on the plateform after 2015. The current usage metrics is available 48-96 hours after online publication and is updated daily on week days.
Initial download of the metrics may take a while.