Fig. 12
Download original image
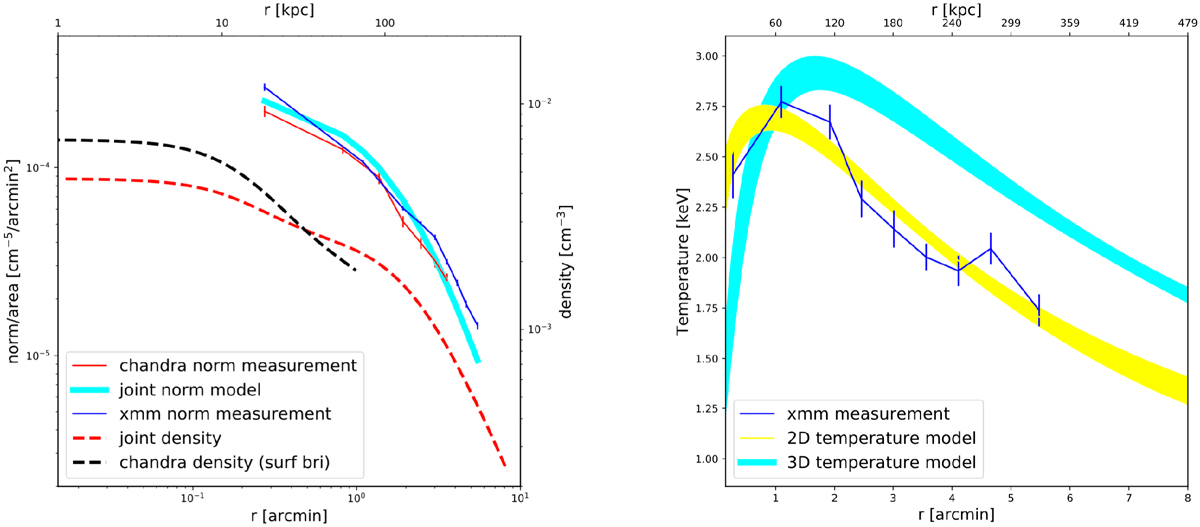
Left: profiles of apec normalization per area measured with XMM-Newton (blue solid) and Chandra (red solid). Red dashed lines indicate the best-fit 3D density profiles for an empirical density profile of Eq. (9) through a joint-fit of XMM-Newton and Chandra normalization profile. The corresponding normalization per area profiles derived with the best-fit 3D density profiles are shown in the cyan line, displaying good agreement with the measurements. Black dashed line is the deprojected density profile derived from Chandra surface brightness profile and the Chandra spectral analysis of the innermost bin. Right: projected temperature profile measured with XMM-Newton (blue solid line). The best-fit deprojected temperature profile is shown in cyan. The corresponding projected temperature profile derived from Eq. (16) is shown in yellow, in good consistent with the measurement.
Current usage metrics show cumulative count of Article Views (full-text article views including HTML views, PDF and ePub downloads, according to the available data) and Abstracts Views on Vision4Press platform.
Data correspond to usage on the plateform after 2015. The current usage metrics is available 48-96 hours after online publication and is updated daily on week days.
Initial download of the metrics may take a while.