Fig. 10
Download original image
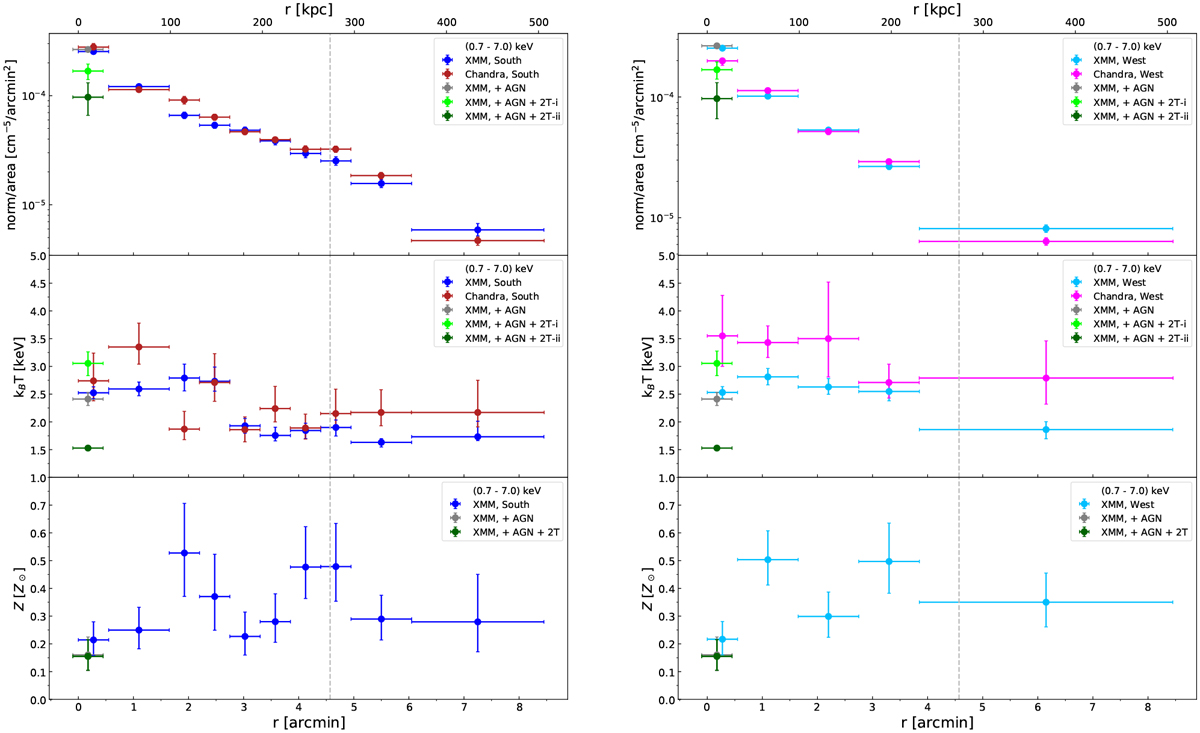
Normalization (top), temperature (middle), and metallicity (bottom) profiles of the Northern Clump derived in the energy band 0.7–7.0 keV. Left: southern region profiles. The blue and red data points represent XMM-Newton and Chandra, respectively. Right: western region profiles. The cyan and magenta data points represent XMM-Newton and Chandra, respectively. Due to modest photon counts, Chandra metallicity could not be constrained in any sectors. The central data points fitted with AGN component are shown in grey, light green and dark green. These data points are shifted for visualization purposes. The grey dashed lines indicate the R25oo of the cluster. The x-axis error bars are not the 1σ error range, but the full width of the bins.
Current usage metrics show cumulative count of Article Views (full-text article views including HTML views, PDF and ePub downloads, according to the available data) and Abstracts Views on Vision4Press platform.
Data correspond to usage on the plateform after 2015. The current usage metrics is available 48-96 hours after online publication and is updated daily on week days.
Initial download of the metrics may take a while.