Fig. 1
Download original image
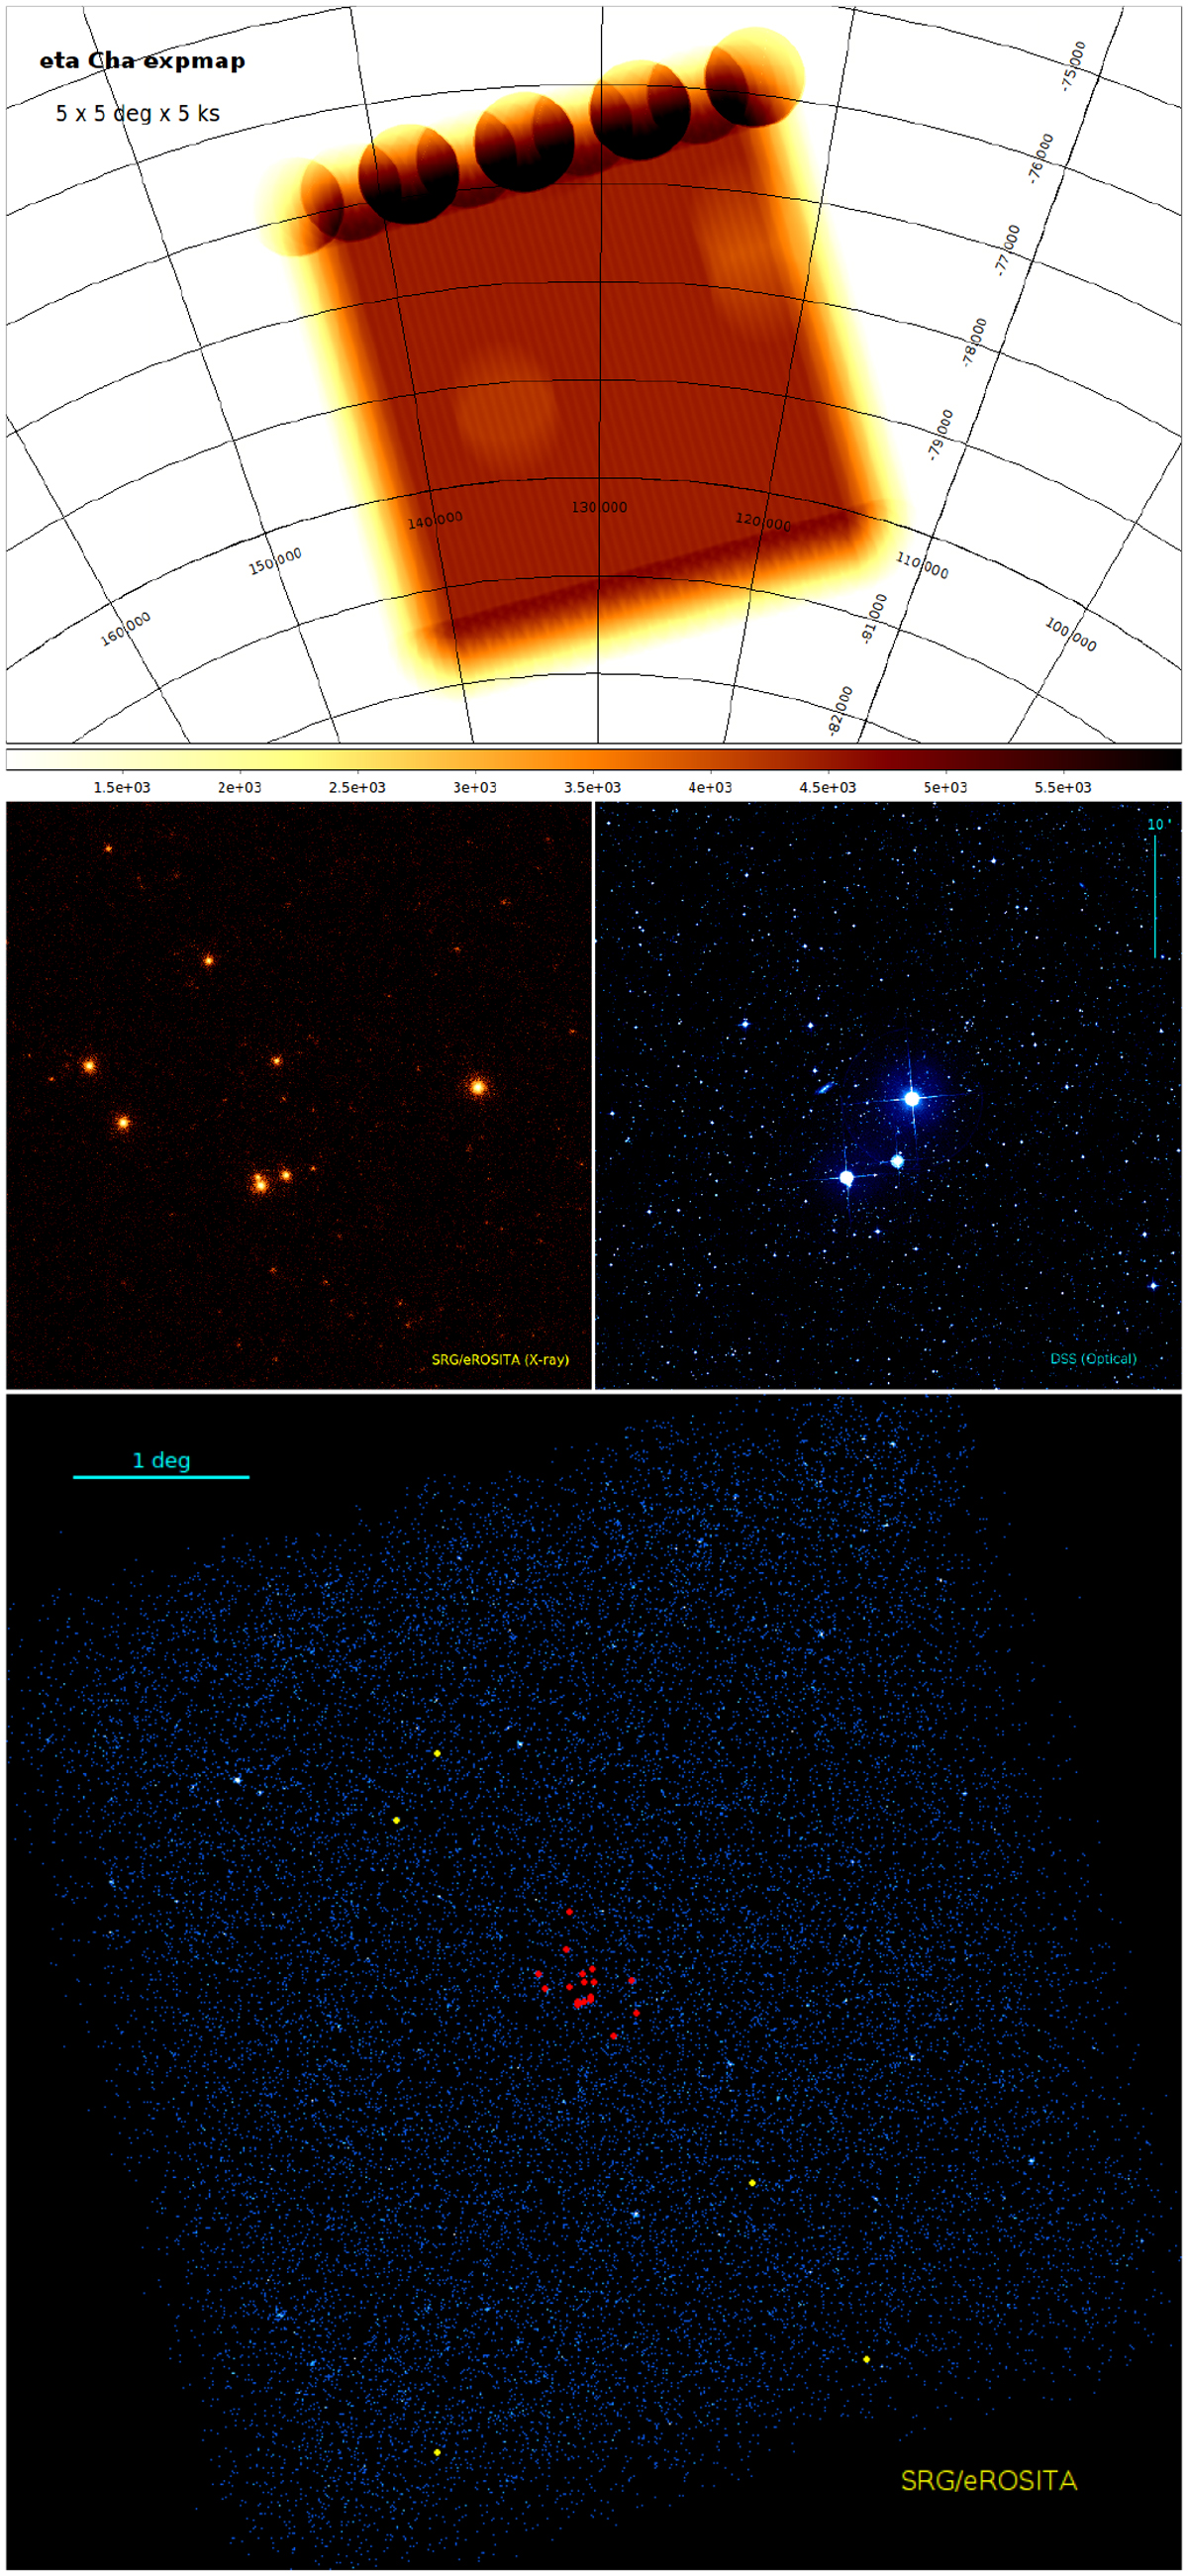
Overview of the eROSITA η Cha field scan observation. X-ray exposure map (top) with linear scaling to facilitate showing the scanning direction and spacecraft maneuver holding points. The color scale denotes exposure in (s). A comparison of the X-ray and optical images of the cluster core showing the same sky region (middle), and an X-ray image of the η Cha field (bottom) in which known (red) and new (yellow) cluster members are marked. The field contains nearly 8000 X-ray sources.
Current usage metrics show cumulative count of Article Views (full-text article views including HTML views, PDF and ePub downloads, according to the available data) and Abstracts Views on Vision4Press platform.
Data correspond to usage on the plateform after 2015. The current usage metrics is available 48-96 hours after online publication and is updated daily on week days.
Initial download of the metrics may take a while.