Fig. 8
Download original image
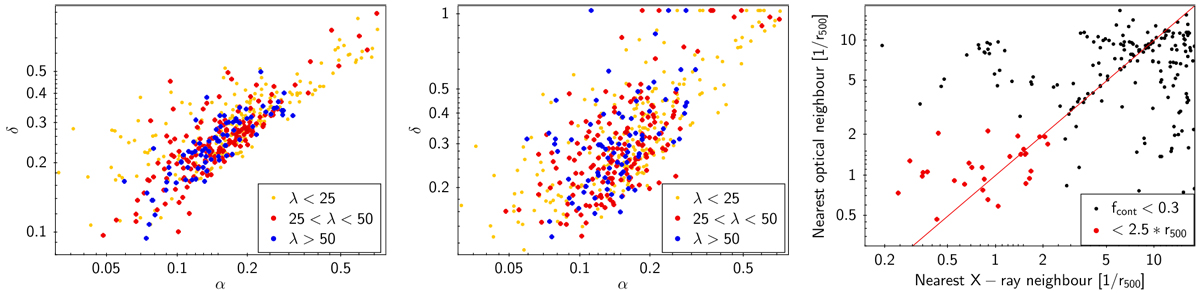
Dynamical state estimators. Left and middle panels: comparison between the three estimators defined in Wen & Han (2013). Three different richness bins are color-coded. Right: distance to the next neighbor found in the galaxy density map vs. distance to the next neighbor in the X-ray cluster catalog. The one-to-one relation is indicated as a red line. Clusters showing a near neighbor within ~2.5 * r500 in both X-ray and optical are likely cluster pairs that potentially are merging.
Current usage metrics show cumulative count of Article Views (full-text article views including HTML views, PDF and ePub downloads, according to the available data) and Abstracts Views on Vision4Press platform.
Data correspond to usage on the plateform after 2015. The current usage metrics is available 48-96 hours after online publication and is updated daily on week days.
Initial download of the metrics may take a while.