Fig. 3
Download original image
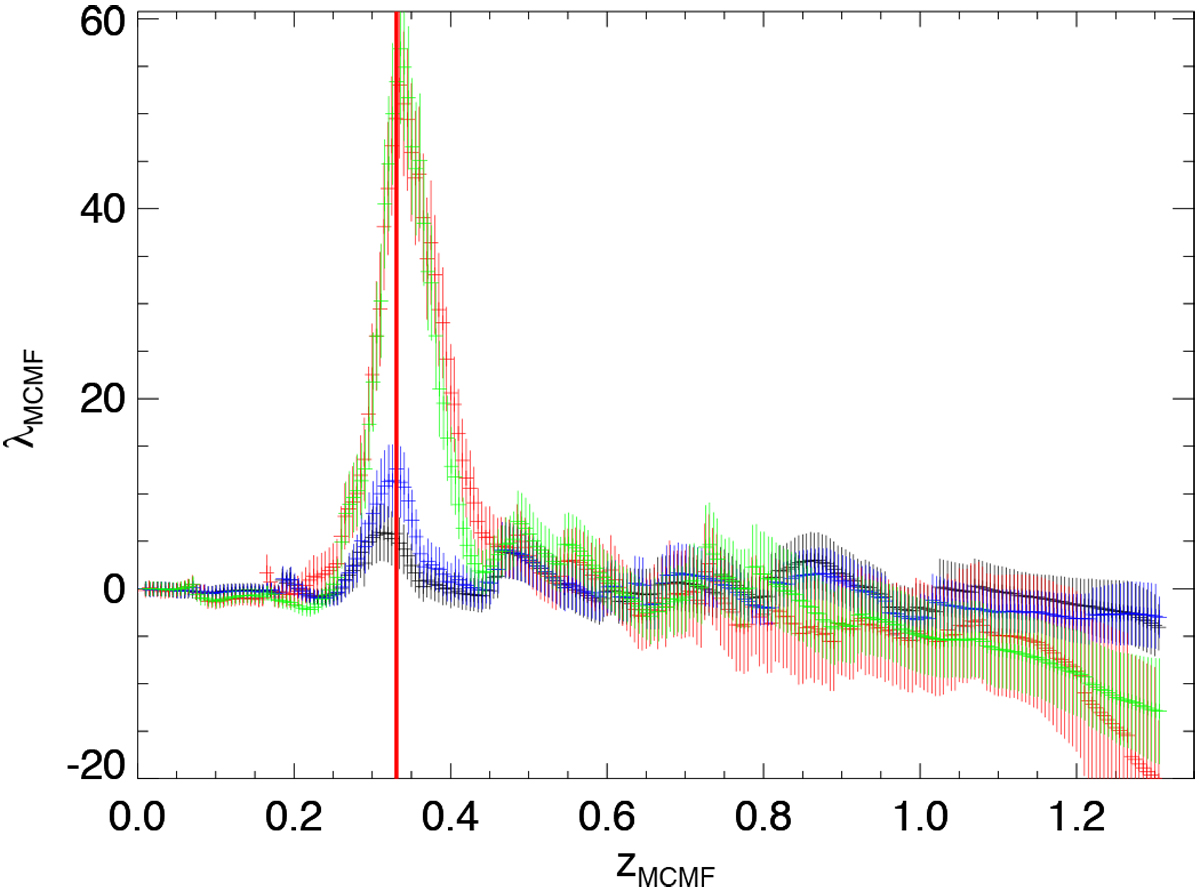
Similar to Fig. 2, richness vs. redshift plot for eFEDS J092739.7-010427 for four MCMF runs. The runs using LS (red and green) both show a clear cluster peak and agree well with one other. The MCMF runs using HSC S19A data (black) and S20A data (blue) show a significantly smaller peak due to local offsets in the photometric zeropoint.
Current usage metrics show cumulative count of Article Views (full-text article views including HTML views, PDF and ePub downloads, according to the available data) and Abstracts Views on Vision4Press platform.
Data correspond to usage on the plateform after 2015. The current usage metrics is available 48-96 hours after online publication and is updated daily on week days.
Initial download of the metrics may take a while.