Fig. C.1
Download original image
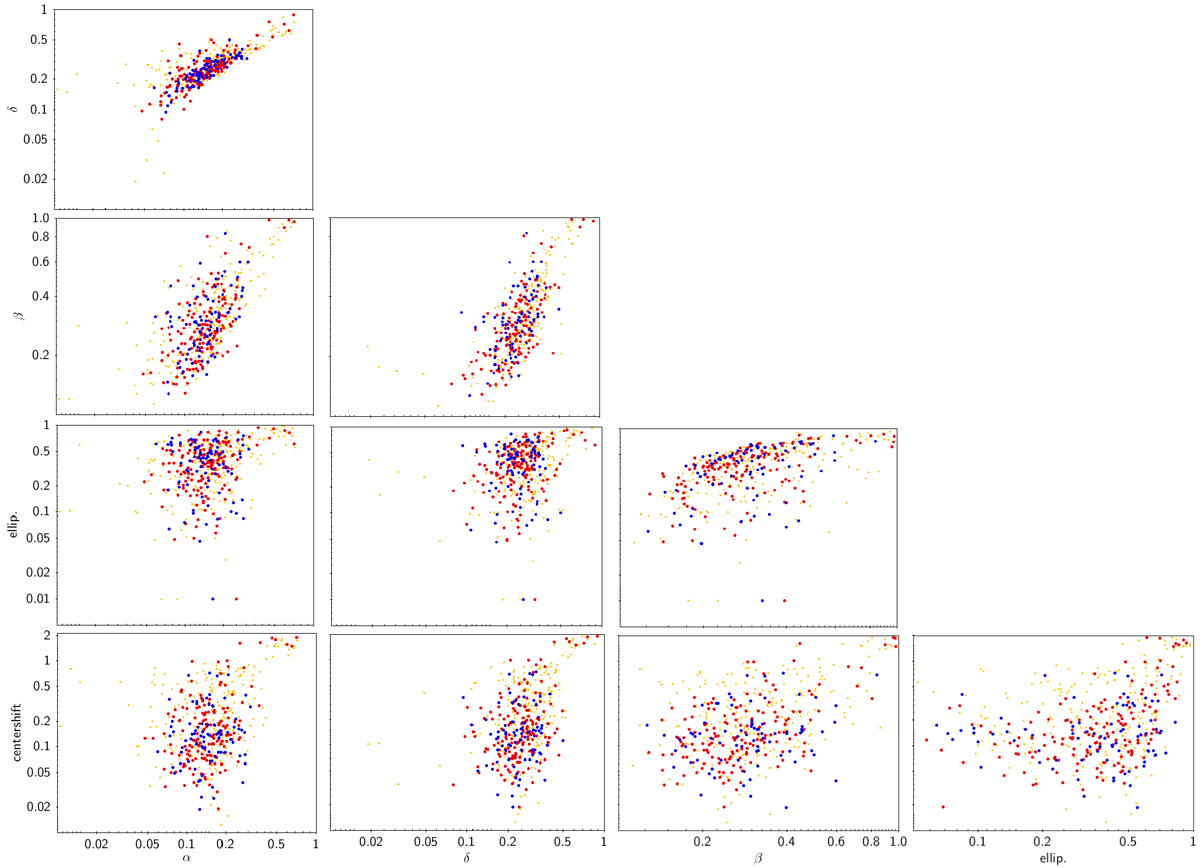
Comparison of the five different optical estimators of cluster dynamical state that are based on model fitting to the red-sequence galaxy density map. The same richness thresholds as in Fig. C.1 are color-coded: yellow for λ < 25, red for 25λ < 50, and blue for λ > 50.
Current usage metrics show cumulative count of Article Views (full-text article views including HTML views, PDF and ePub downloads, according to the available data) and Abstracts Views on Vision4Press platform.
Data correspond to usage on the plateform after 2015. The current usage metrics is available 48-96 hours after online publication and is updated daily on week days.
Initial download of the metrics may take a while.