Fig. 21
Download original image
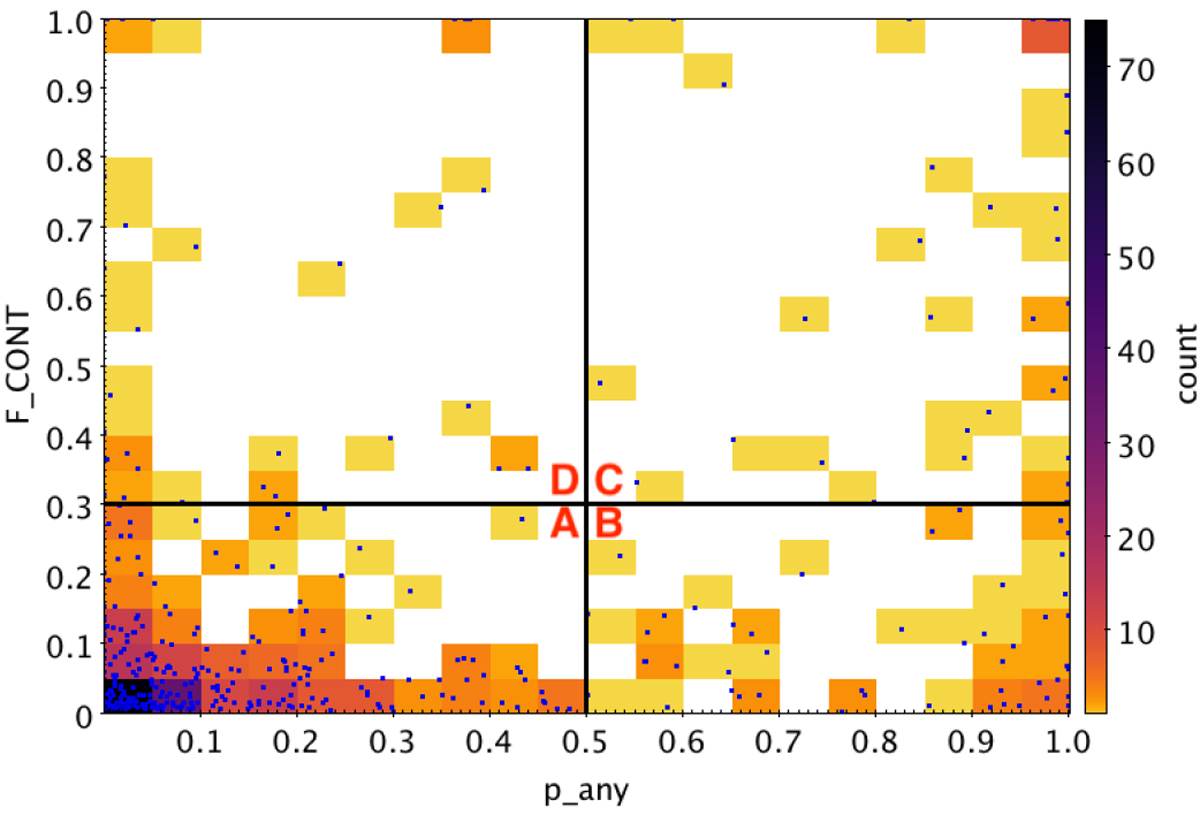
Distribution of the sample in two confirmation proxies fcont and pany. Black lines split the sources into four sectors (A, B, C, and D). Most sources are at low pany and low fcont (sector A), suggesting that they are good clusters without a good point-like counterpart. The second densest point is at high pany and fcont (sector C), suggesting a good AGN. The bottom right corner (low fcont, high pany, sector B) is the region in which both codes find counterparts and where further reconciliation is required, while in the top left corner (sector D) lie sources without a good counterpart in any of the codes.
Current usage metrics show cumulative count of Article Views (full-text article views including HTML views, PDF and ePub downloads, according to the available data) and Abstracts Views on Vision4Press platform.
Data correspond to usage on the plateform after 2015. The current usage metrics is available 48-96 hours after online publication and is updated daily on week days.
Initial download of the metrics may take a while.