Fig. 2
Download original image
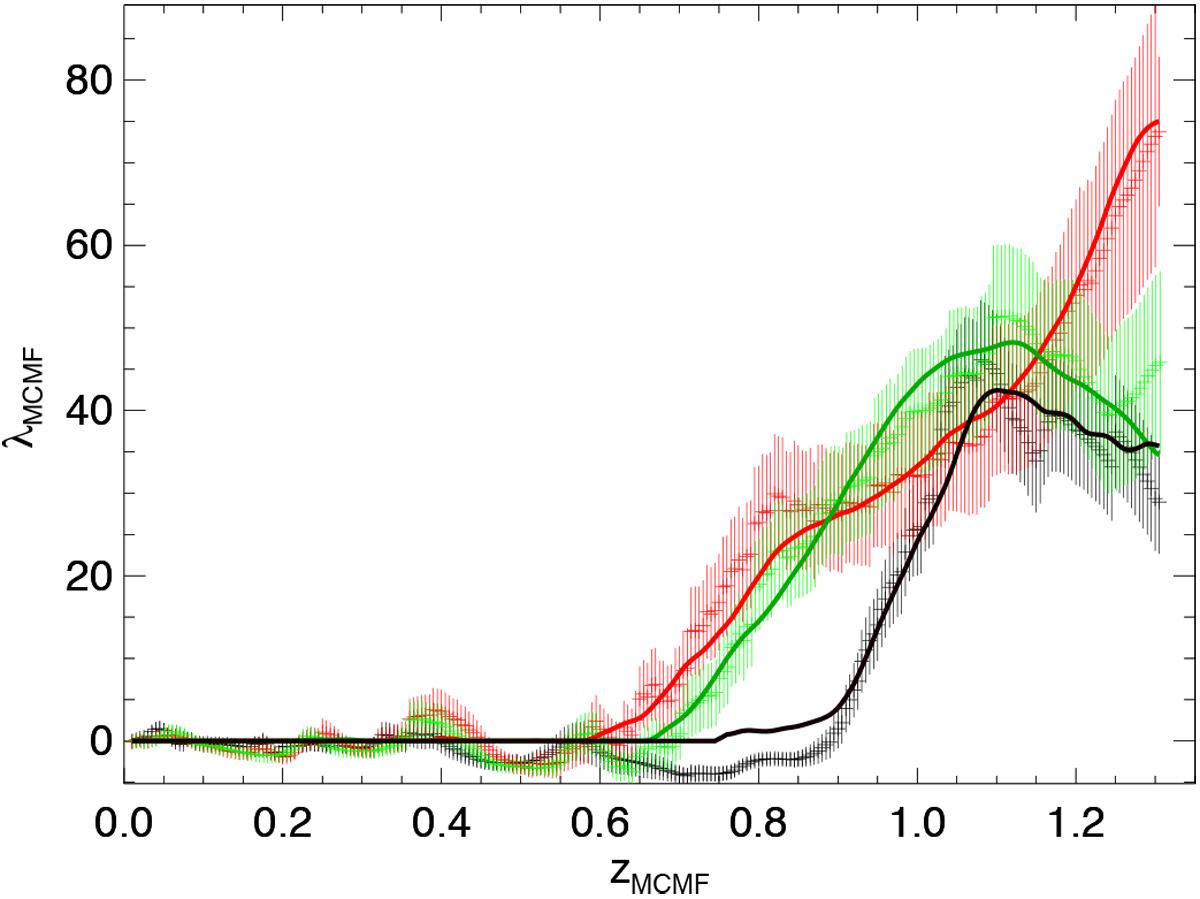
MCMF richness vs. redshift plot for the z = 1.1 cluster eFEDS J084044.7+024108. In red and green we plot the output of MCMF on LS data, using grz and grzW1, respectively. The run on HSC is shown in black. The continuous lines show the best-fit peak profile at the cluster redshift.
Current usage metrics show cumulative count of Article Views (full-text article views including HTML views, PDF and ePub downloads, according to the available data) and Abstracts Views on Vision4Press platform.
Data correspond to usage on the plateform after 2015. The current usage metrics is available 48-96 hours after online publication and is updated daily on week days.
Initial download of the metrics may take a while.