Fig. 17
Download original image
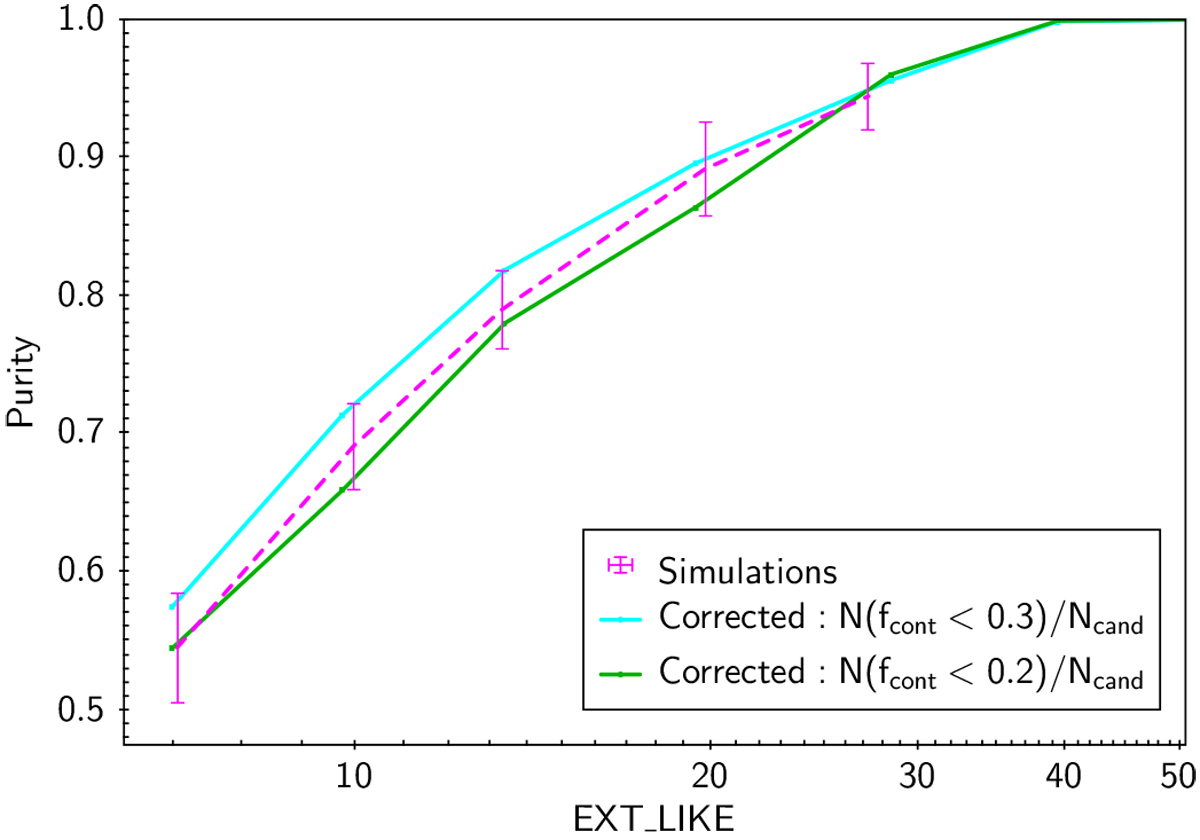
Expected purity and recovered confirmation fraction as a function of extent likelihood. The expected fraction of real clusters from dedicated eFEDS simulations is shown in magenta. The error bars indicate the standard deviation derived from 18 realizations of the simulations. Blue shows the fraction of fcont < 0.3 systems corrected for the expected number of residual contaminants. Green is similar, but for fcont < 0.2. The difference between the green and blue line is an indication of the incompleteness caused by the stricter fcont selection.
Current usage metrics show cumulative count of Article Views (full-text article views including HTML views, PDF and ePub downloads, according to the available data) and Abstracts Views on Vision4Press platform.
Data correspond to usage on the plateform after 2015. The current usage metrics is available 48-96 hours after online publication and is updated daily on week days.
Initial download of the metrics may take a while.