Fig. 16
Download original image
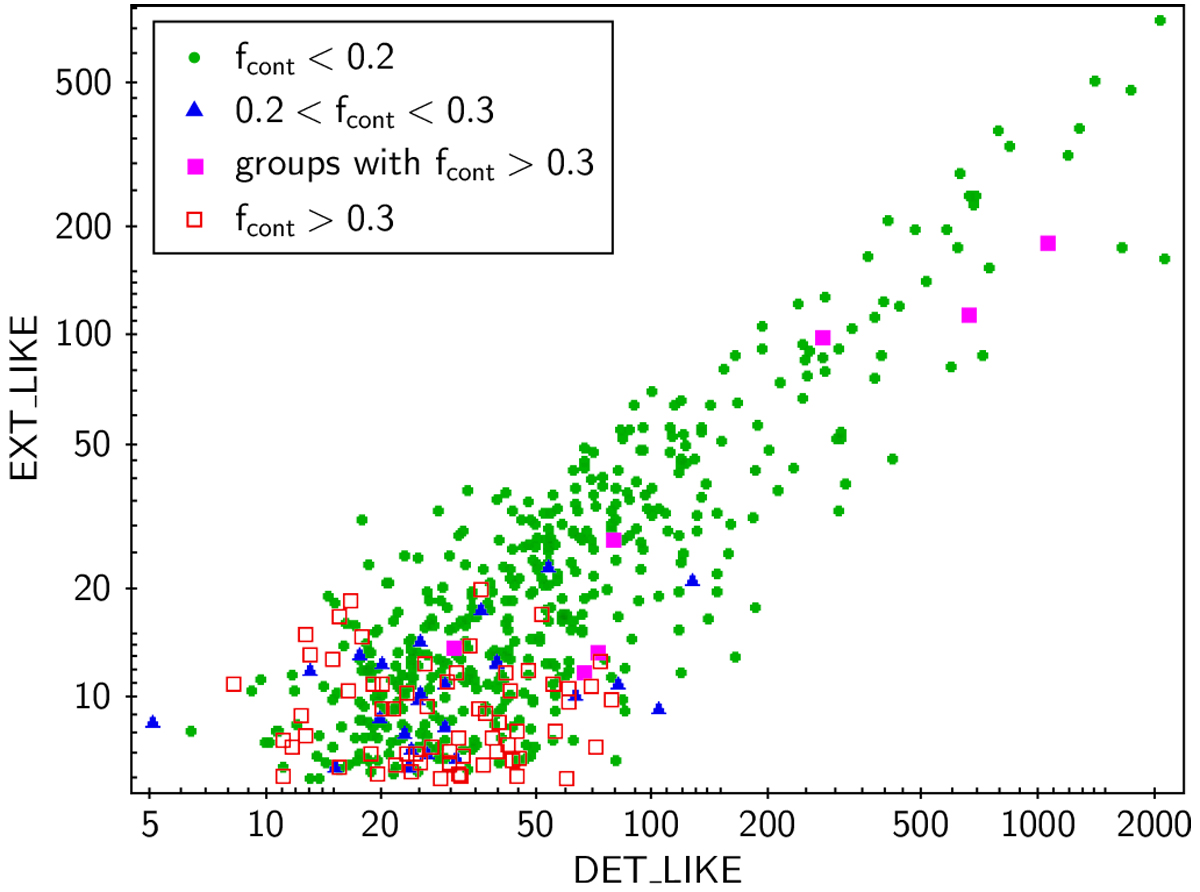
Distribution of X-ray cluster candidates in X-ray extent likelihood vs. detection likelihood, two of three key selection parameters. Clusters confirmed by MCMF are shown in green and blue. Unconfirmed clusters are shown in red. Systems not confirmed by MCMF but via cross-matching with group catalogs are shown as magenta squares. Unconfirmed systems lie at low likelihood values where contaminants are expected.
Current usage metrics show cumulative count of Article Views (full-text article views including HTML views, PDF and ePub downloads, according to the available data) and Abstracts Views on Vision4Press platform.
Data correspond to usage on the plateform after 2015. The current usage metrics is available 48-96 hours after online publication and is updated daily on week days.
Initial download of the metrics may take a while.