Fig. 13
Download original image
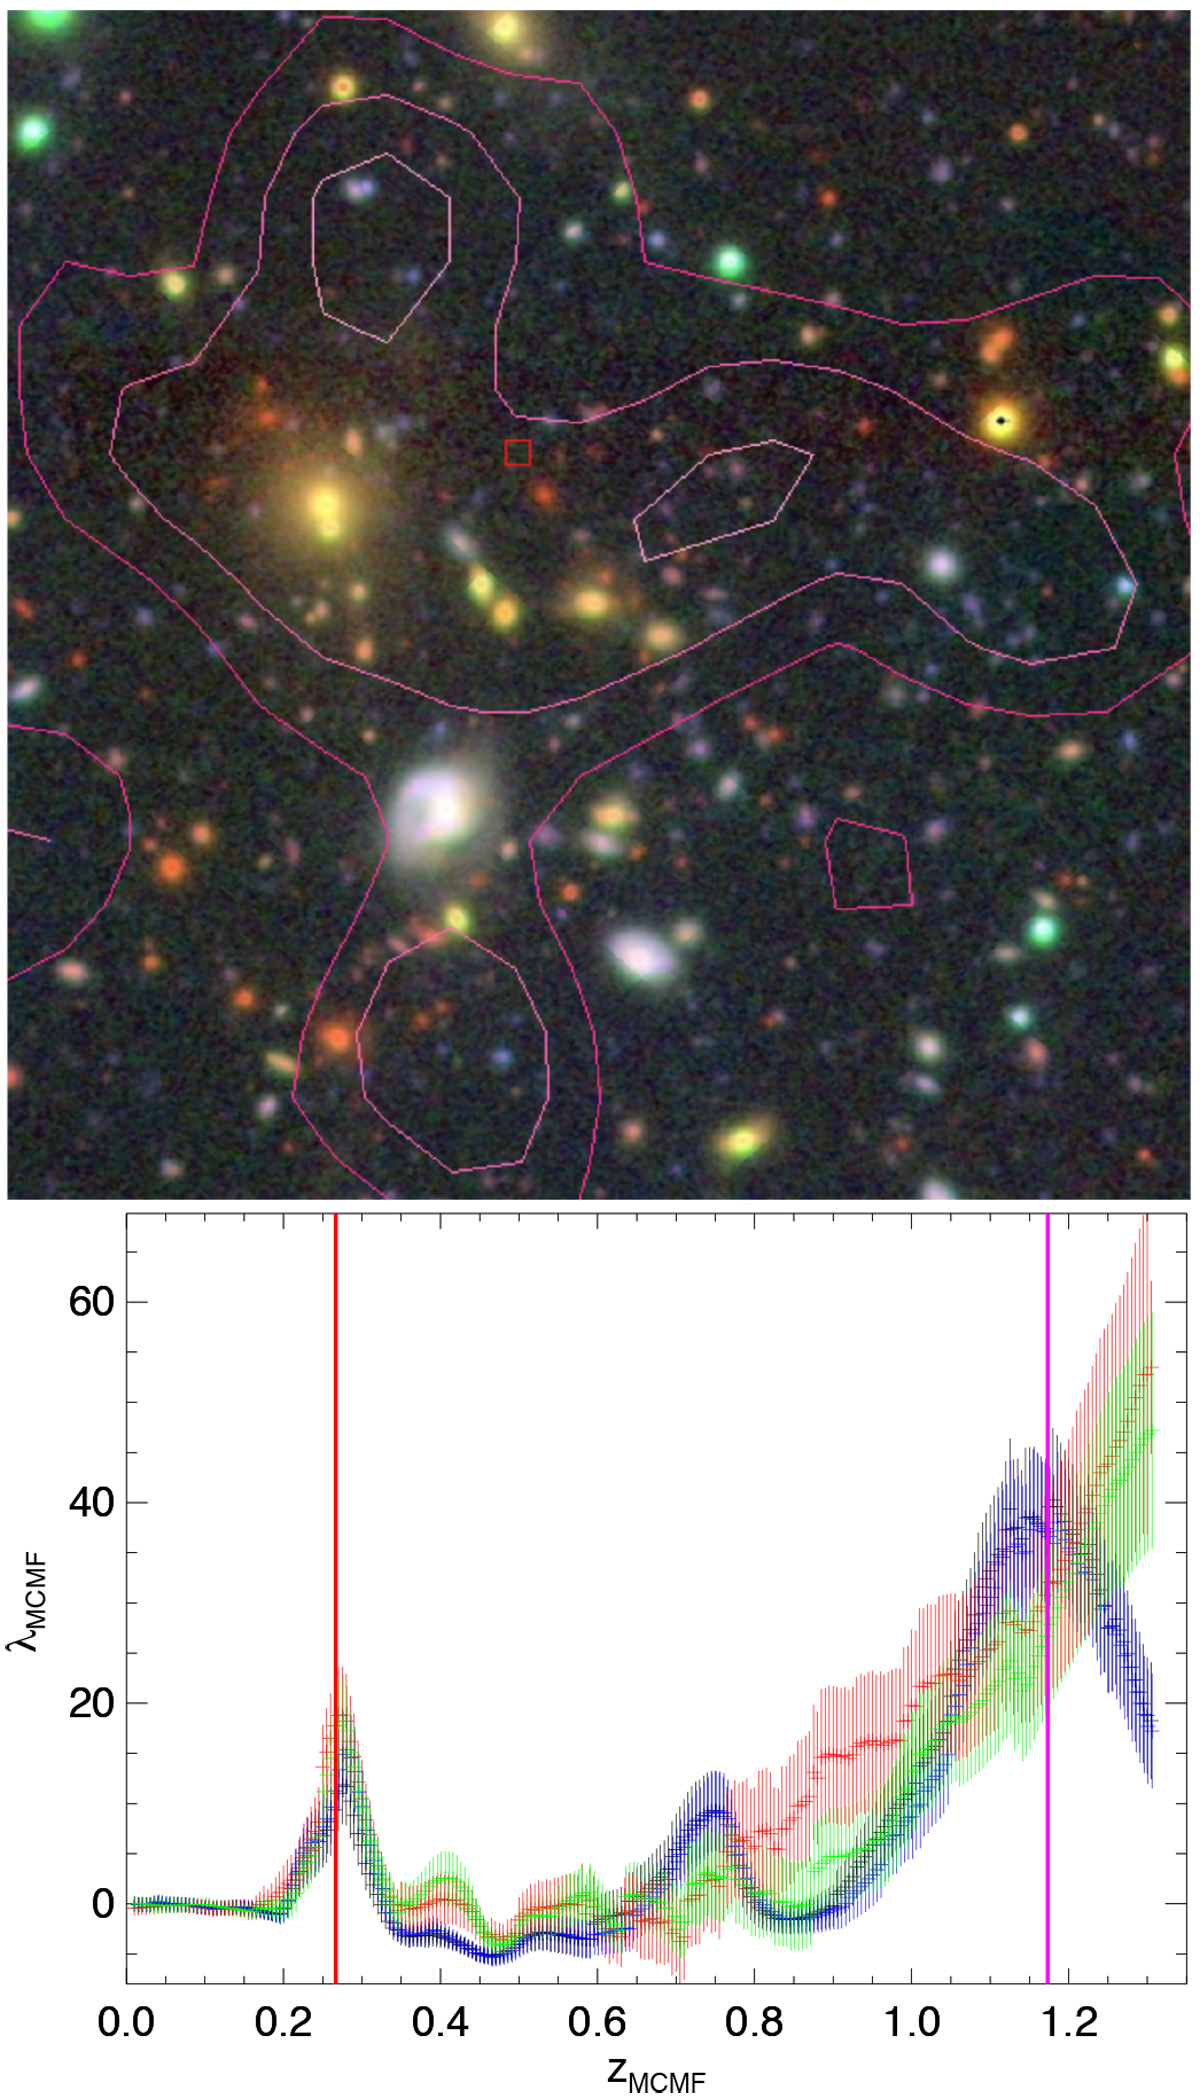
X-ray source eFEDS J091646.9+015531. Top: HSC grz-color image of the central 2.5 × 2.5 arcmin region with X-ray contours overlaid. Bottom: MCMF richness vs. redshift plot, one of three cases of a photo-z mismatch with positional matches from the ACT-DR5 cluster catalog. MCMF finds two counterparts that are highlighted with vertical lines. The richer system at z = 1.17 is consistent with the ACT cluster. The different sensitivity to redshift for X-rays suggests that the low redshift is the better counterpart to the eFEDS source. Colors indicate different MCMF runs: HSC S19A (black), HSC S20A (blue), LS grz (red), and LS grzw1 (green) bands.
Current usage metrics show cumulative count of Article Views (full-text article views including HTML views, PDF and ePub downloads, according to the available data) and Abstracts Views on Vision4Press platform.
Data correspond to usage on the plateform after 2015. The current usage metrics is available 48-96 hours after online publication and is updated daily on week days.
Initial download of the metrics may take a while.