Fig. 12
Download original image
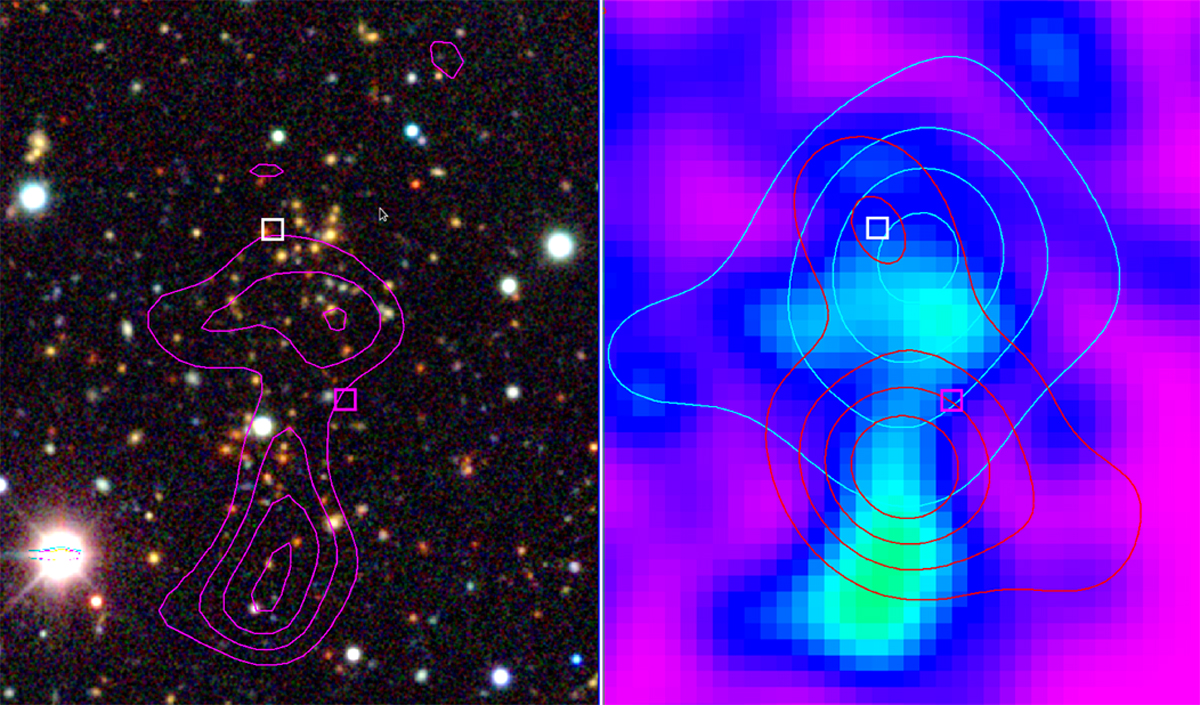
2.5 × 3 arcmin region around eFEDS J083120.5+030949 (ACT-CL J0831.3+0310). Left: LS grz-band color image. Magenta contours are drawn from the X-ray surface brightness map, shown in the right panel. The magenta box shows the eFEDS position, and the white box shows the SZ position from ACT. Right: X-ray map, showing X-ray and SZ position with density contours for passive galaxies at z = 0.569 (cyan) and z = 0.852 (red).
Current usage metrics show cumulative count of Article Views (full-text article views including HTML views, PDF and ePub downloads, according to the available data) and Abstracts Views on Vision4Press platform.
Data correspond to usage on the plateform after 2015. The current usage metrics is available 48-96 hours after online publication and is updated daily on week days.
Initial download of the metrics may take a while.