Fig. 1
Download original image
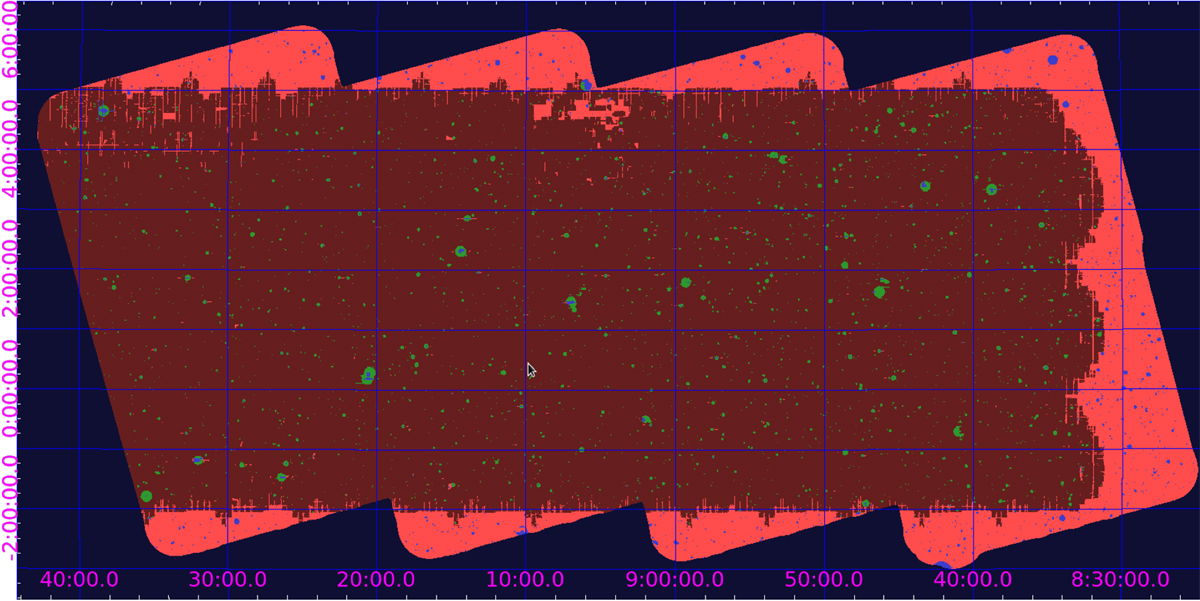
eFEDS footprint and its coverage with HSC and LS data. Dark red shows the HSC and LS coverage, and light red shows the area that is covered by LS alone. Green and blue indicate masked regions. The masking is mostly caused by bright star masks. In addition to the masked regions, the full eFEDS footprint is covered either by HSC or LS.
Current usage metrics show cumulative count of Article Views (full-text article views including HTML views, PDF and ePub downloads, according to the available data) and Abstracts Views on Vision4Press platform.
Data correspond to usage on the plateform after 2015. The current usage metrics is available 48-96 hours after online publication and is updated daily on week days.
Initial download of the metrics may take a while.