Fig. 9
Download original image
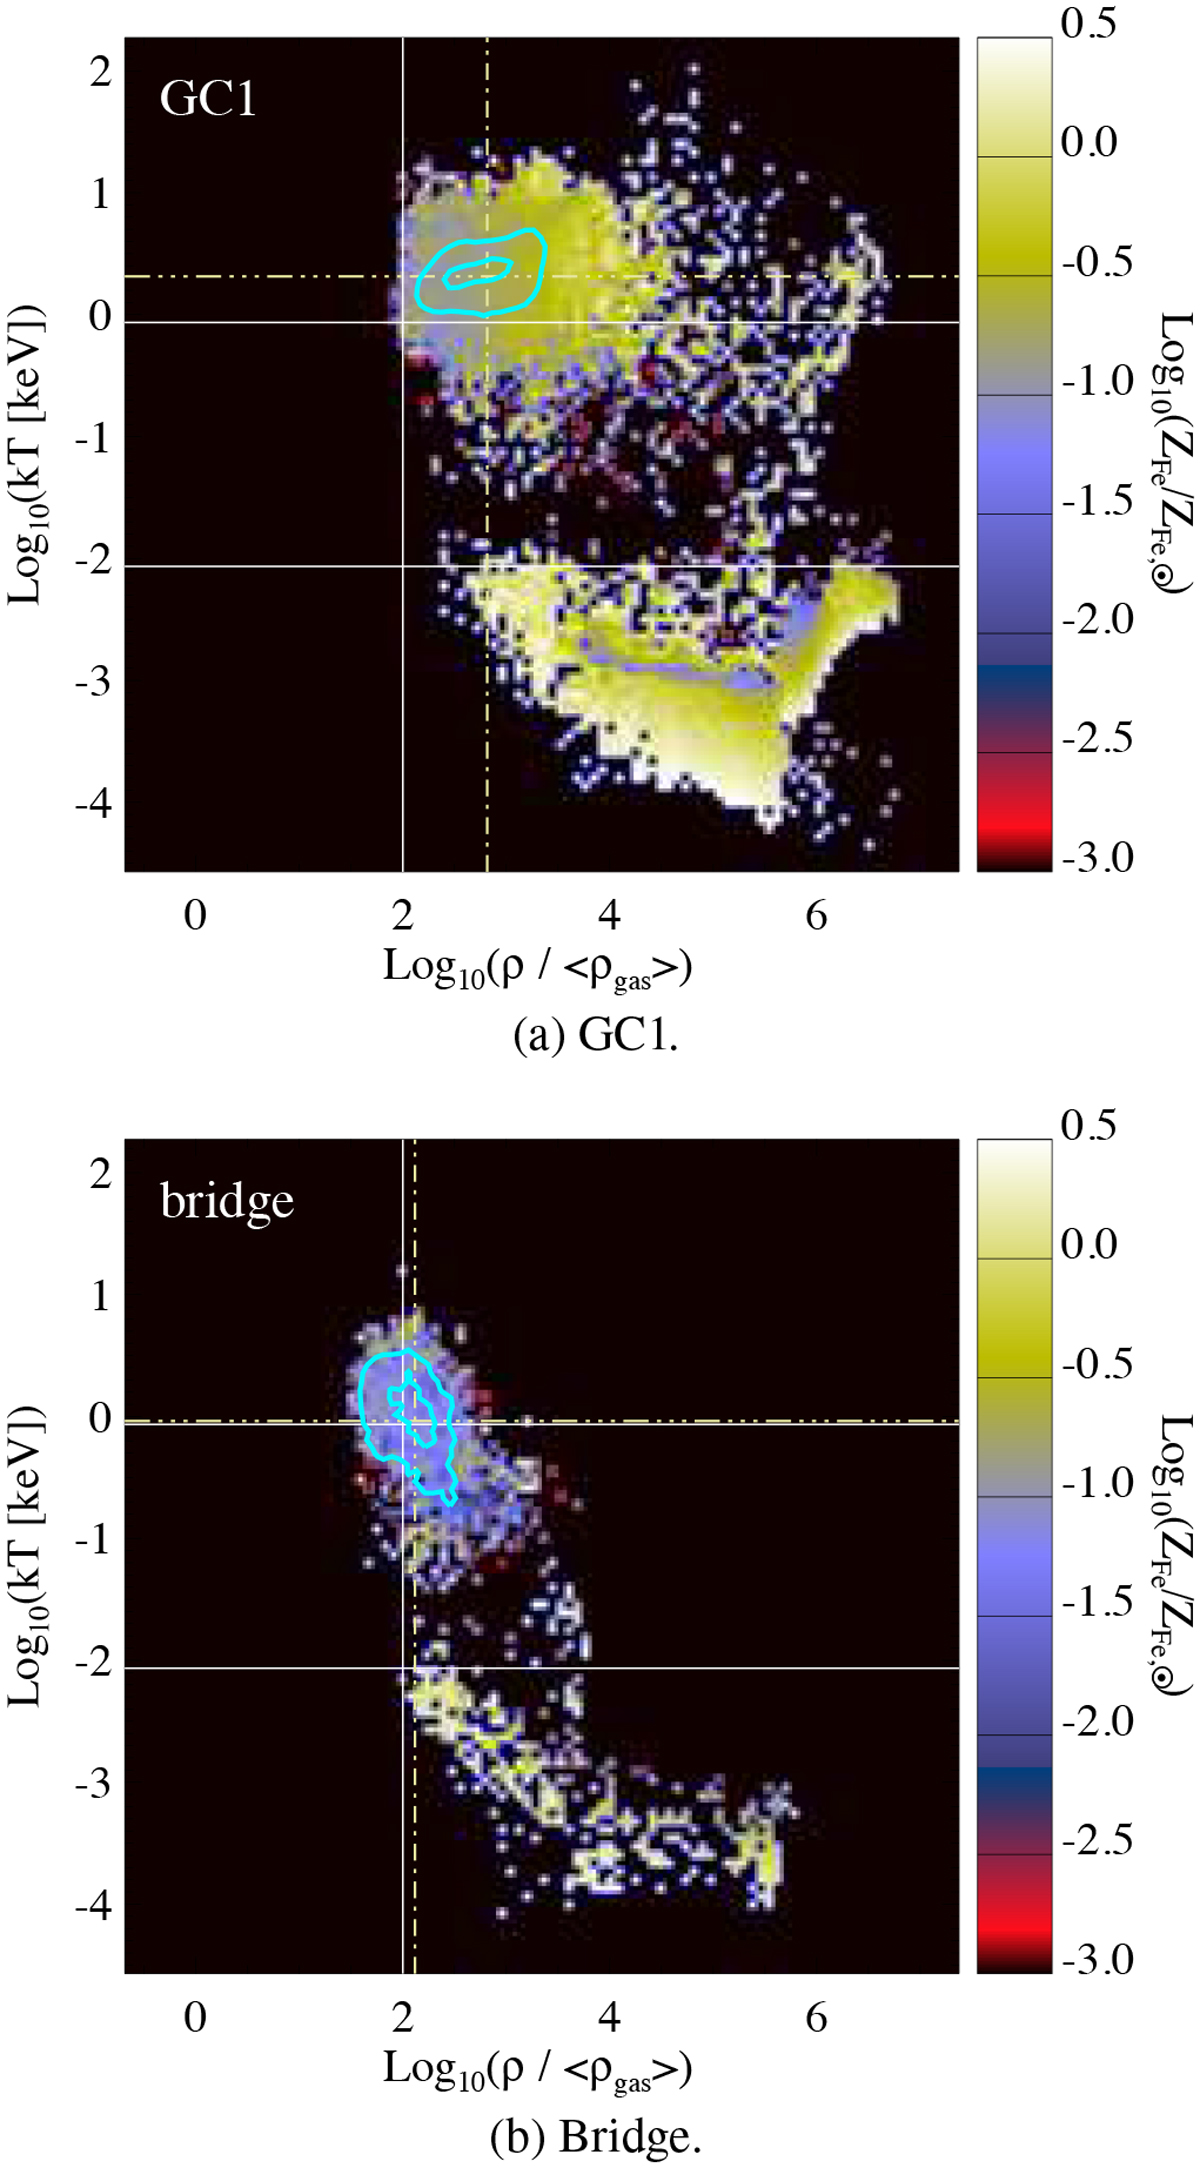
Same as Fig. 8, but only for the gas within R200 for one of the member clusters, namely GC1 (upper panel) and for the gas in the bridge (lower panel) between the pair clusters, at z = 0.07. Dot-dashed lines mark the average temperature and overdensity values (mass-weighted estimate) of the selected gas.
Current usage metrics show cumulative count of Article Views (full-text article views including HTML views, PDF and ePub downloads, according to the available data) and Abstracts Views on Vision4Press platform.
Data correspond to usage on the plateform after 2015. The current usage metrics is available 48-96 hours after online publication and is updated daily on week days.
Initial download of the metrics may take a while.