Fig. 6
Download original image
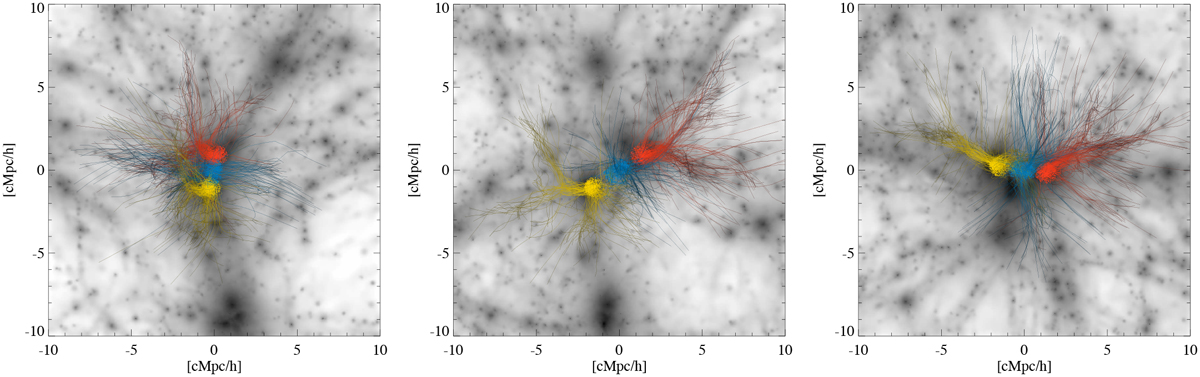
Gas density maps in the three main projection axes (z, y, and x simulation axis, from left to right) at z = 0.07. Each map, centred on the cluster pair, encloses a cubic volume of 20 h−1 cMpc per side. We overplot in red, yellow, and blue the spatial trajectories of the gas particles that are finally selected within R500 of GC1 and GC2 and in the bridge at z = 0.07. Each trajectory shows a colour gradient with time, from dark at z ~ 2 to light at z= 0.07.
Current usage metrics show cumulative count of Article Views (full-text article views including HTML views, PDF and ePub downloads, according to the available data) and Abstracts Views on Vision4Press platform.
Data correspond to usage on the plateform after 2015. The current usage metrics is available 48-96 hours after online publication and is updated daily on week days.
Initial download of the metrics may take a while.