Fig. 4
Download original image
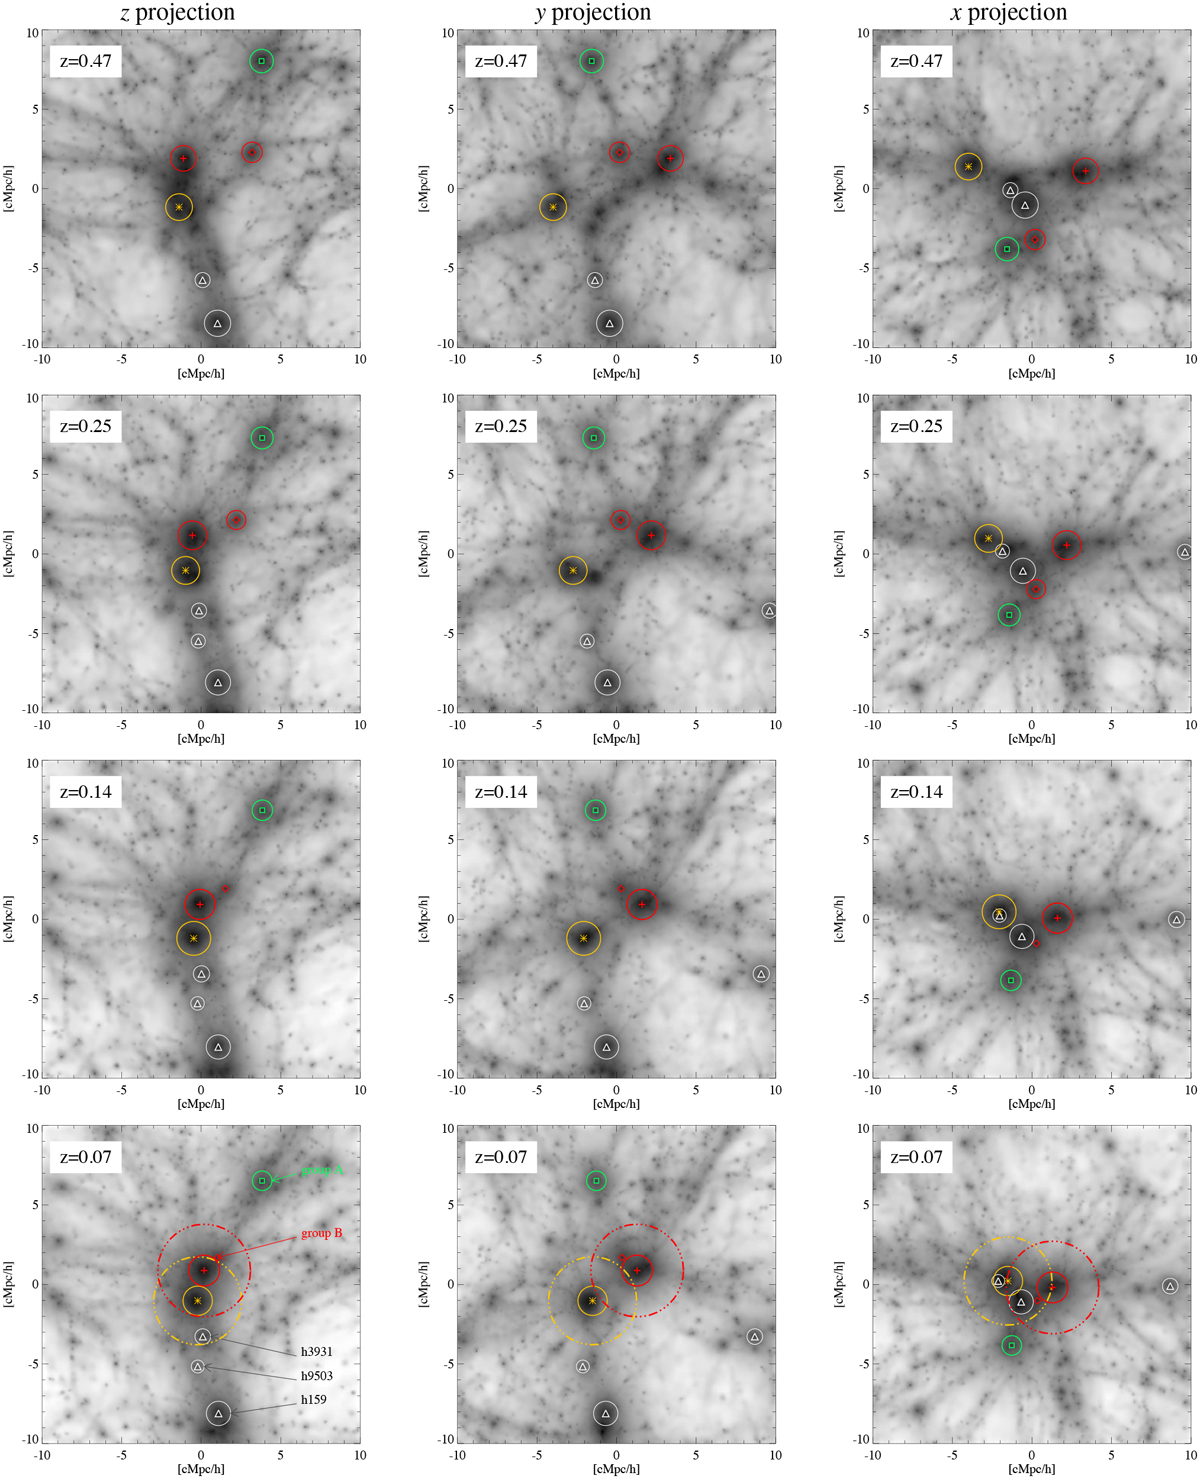
Evolution of the main haloes in the pair region in the three main projection axes (z, y, and x, from left to right). The maps show the projected gas density within a (20 h−1 cMpc)3 comoving volume centred on the final (at z = 0.07) pair centre of mass for different redshifts between z = 0.47 and z = 0.07 (from top to bottom). We mark GC1 and GC2 (red cross and yellow asterisk, respectively), the two northern groups A and B (green square and red diamond), and the additional main group-size haloes in the region (white triangles) and their progenitors. For each halo, circles approximate their R200 extent, except for group B at z ≲ 0.16, when it is identified as a substructure gravitationally bound to GC1. For GC1 and GC2, the dot-dashed circles at z = 0.07 correspond to 3 × R200.
Current usage metrics show cumulative count of Article Views (full-text article views including HTML views, PDF and ePub downloads, according to the available data) and Abstracts Views on Vision4Press platform.
Data correspond to usage on the plateform after 2015. The current usage metrics is available 48-96 hours after online publication and is updated daily on week days.
Initial download of the metrics may take a while.