Fig. 2
Download original image
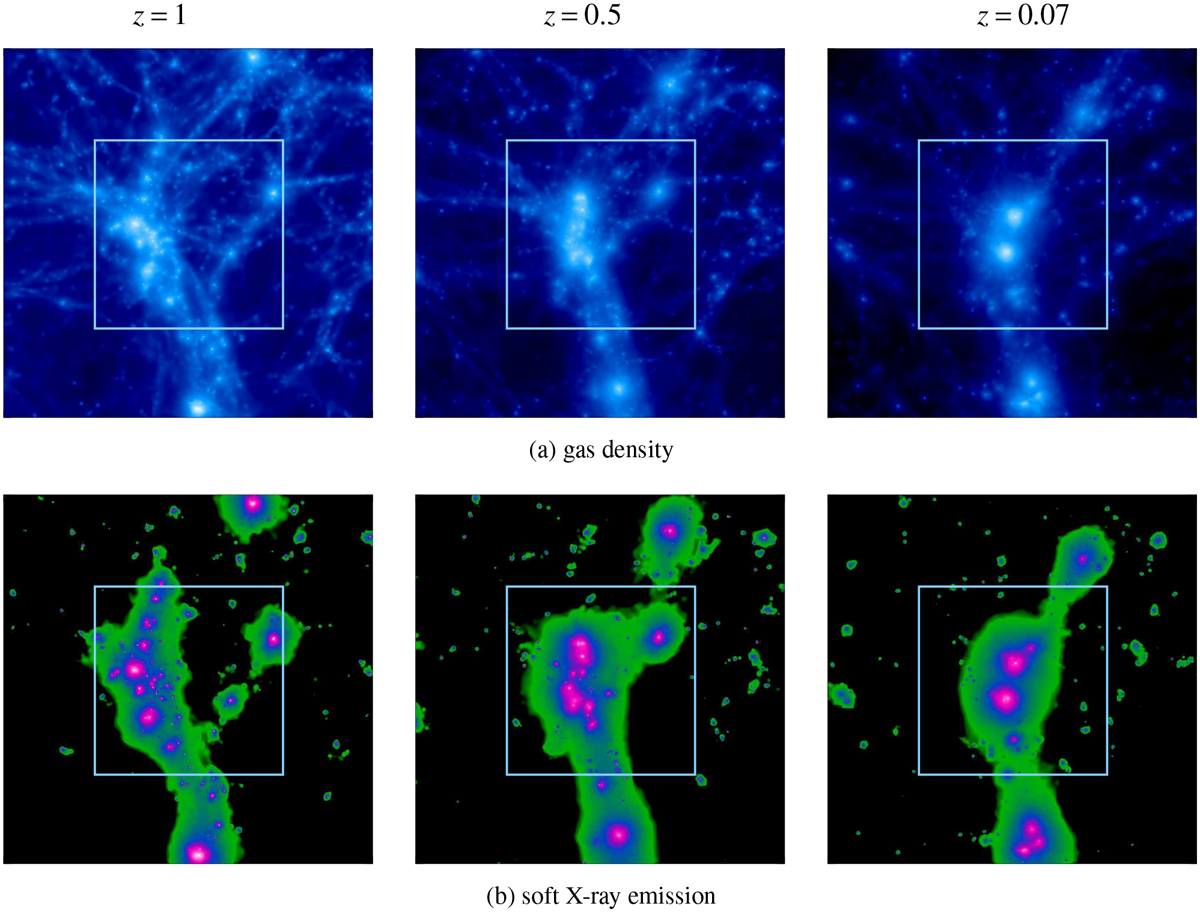
Projected maps of gas density and ideal X-ray emission in the [0.5-2] keV band. Each map is 20 h−1 cMpc per side, integrated for 20 h−1 cMpc along the l.o.s. (z-axis) and centred on the pair centre of mass at z = 0.07. The squares (10 h−1 cMpc per side) approximate the size of the eROSITA observation.
Current usage metrics show cumulative count of Article Views (full-text article views including HTML views, PDF and ePub downloads, according to the available data) and Abstracts Views on Vision4Press platform.
Data correspond to usage on the plateform after 2015. The current usage metrics is available 48-96 hours after online publication and is updated daily on week days.
Initial download of the metrics may take a while.