Fig. 15
Download original image
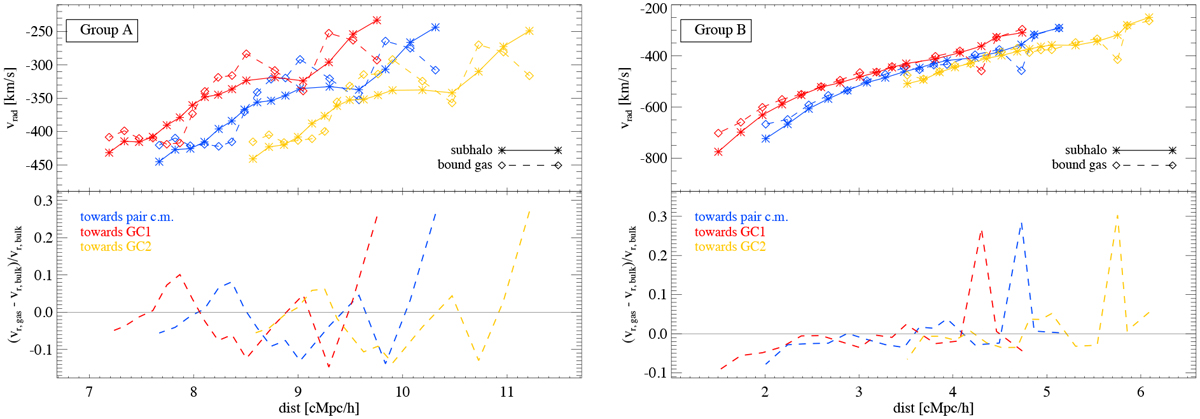
Radial bulk (solid lines) and bound-gas (dashed lines) velocities (upper panels) and their relative absolute difference (lower panels) for groups A and B (left and right, respectively) as a function of the radial distance from the system (centre of mass in blue, GC1 in red, and GC2 in yellow).
Current usage metrics show cumulative count of Article Views (full-text article views including HTML views, PDF and ePub downloads, according to the available data) and Abstracts Views on Vision4Press platform.
Data correspond to usage on the plateform after 2015. The current usage metrics is available 48-96 hours after online publication and is updated daily on week days.
Initial download of the metrics may take a while.