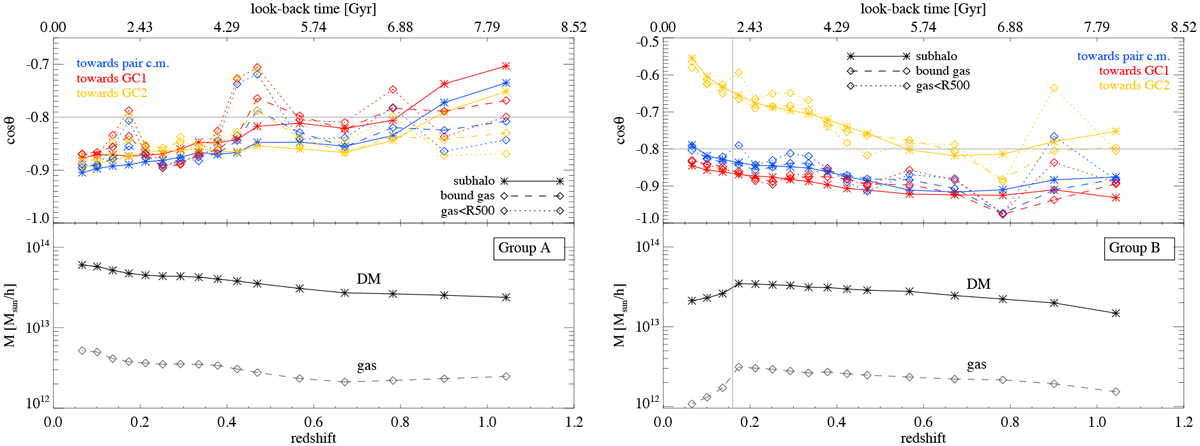
Fig. 14
Download original image
Infall motion and mass evolution of groups A (left panel) and B (right panel) towards the cluster pair. Upper panels: redshift evolution of the alignment between radial direction towards the pair (centre of mass, blue; GC1, red; GC2; yellow) and subhalo velocity (as in the legend), quantified by the cosine of the angle between them. For Group B (right), the gas < R500 at z = 0.16 is tracked to lower redshifts after entering the GC1 virial boundary. Lower panels: redshift evolution of the subhalo DM (solid lines) and gas (dashed lines) bound mass.
Current usage metrics show cumulative count of Article Views (full-text article views including HTML views, PDF and ePub downloads, according to the available data) and Abstracts Views on Vision4Press platform.
Data correspond to usage on the plateform after 2015. The current usage metrics is available 48-96 hours after online publication and is updated daily on week days.
Initial download of the metrics may take a while.