Fig. 1
Download original image
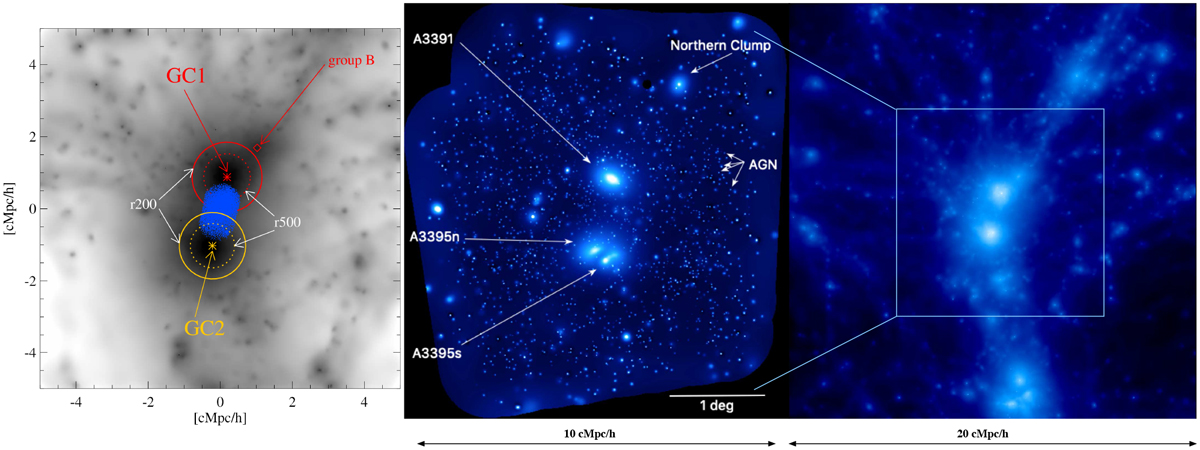
Comparison between the simulated galaxy pair candidate at z = 0.07 and the observed A3391/95 system. Left: zoom onto the projected gas density map of the simulated cluster pair. The image is 10 h−1 cMpc per side and projected for 10 h−1 cMpc along the l.o.s. We label the two clusters GC1 and GC2 and an infalling group (group B), and mark their extent. In blue we show the gas in the interconnecting bridge. Middle: eROSITA PV observation of a ~15 deg2 region around the multiple A3391/95 system, with the main clusters and Northern Clump marked (Reiprich et al. 2021). Here, 1 deg ≈ 3.9 Mpc, at the redshift of A3391 and for the cosmology adopted in Reiprich et al. (2021) (for comparison to simulations, we also report the comoving scale). Right: projected gas density map of the simulated cluster pair in its local environment. The map encloses a (20 h−1 cMpc)3 volume that spans ~26 Mpc (physical) in projection for the chosen redshift and cosmology.
Current usage metrics show cumulative count of Article Views (full-text article views including HTML views, PDF and ePub downloads, according to the available data) and Abstracts Views on Vision4Press platform.
Data correspond to usage on the plateform after 2015. The current usage metrics is available 48-96 hours after online publication and is updated daily on week days.
Initial download of the metrics may take a while.