Fig. 3.
Download original image
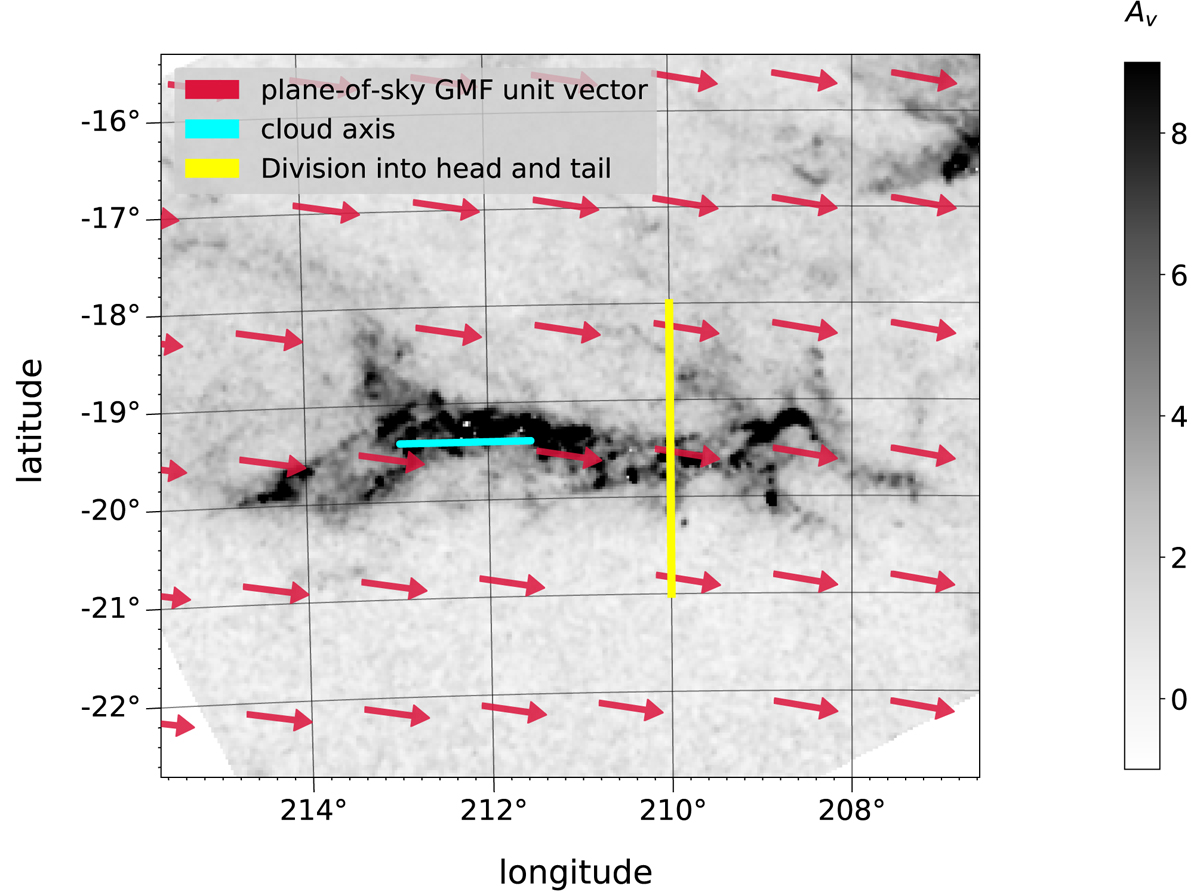
Galactic magnetic field associated with the Orion A cloud. The background grayscale image shows the extinction map from Kainulainen et al. (2009). The yellow line represents the division between the tail and the head of the cloud. The region of Orion A with longitudes less than ∼210° is referred to as the “head” of Orion A, while the portion with longitudes greater than ∼210° is referred to as the “tail”. The red vectors show the Coherent GMF model projected onto the plane of the sky. The cyan line illustrates an approximate filament axis.
Current usage metrics show cumulative count of Article Views (full-text article views including HTML views, PDF and ePub downloads, according to the available data) and Abstracts Views on Vision4Press platform.
Data correspond to usage on the plateform after 2015. The current usage metrics is available 48-96 hours after online publication and is updated daily on week days.
Initial download of the metrics may take a while.