Fig. 1.

Download original image
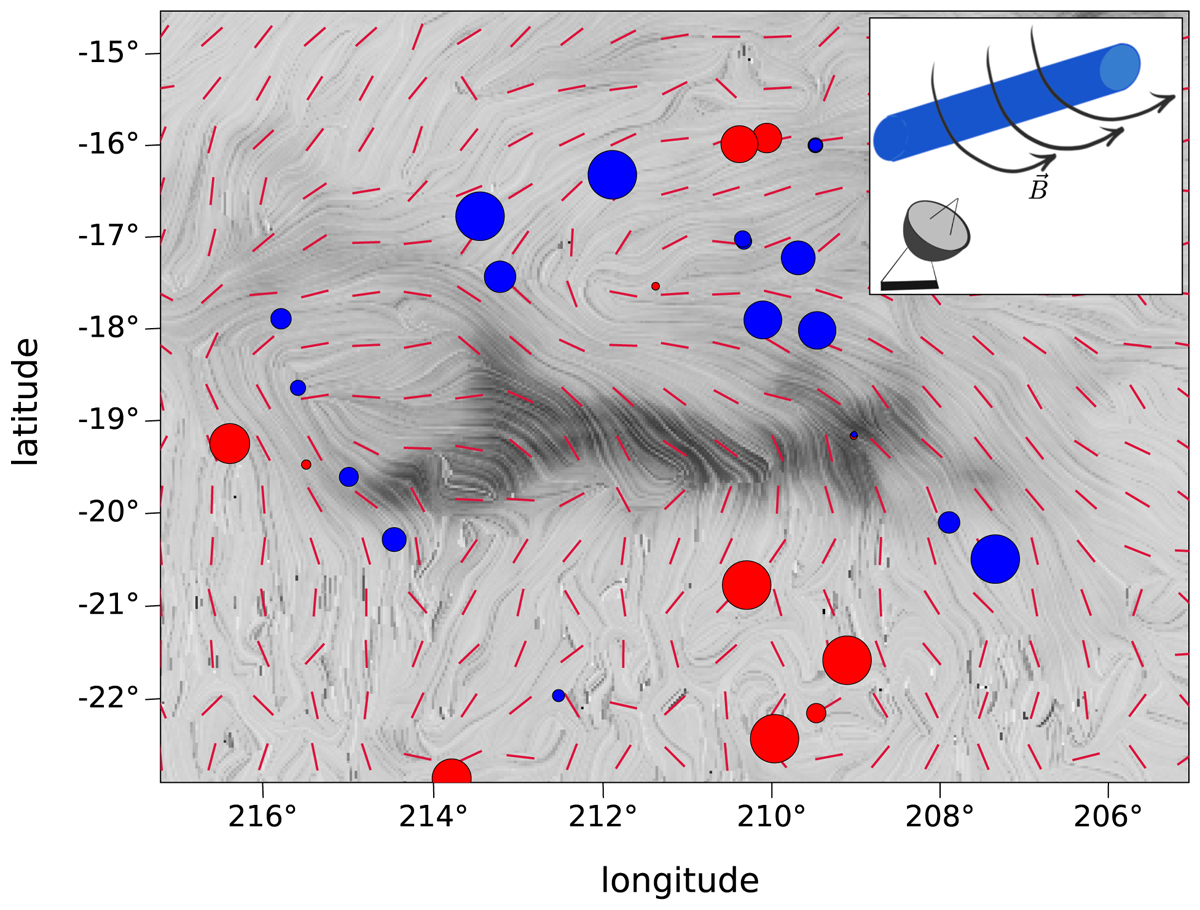
Observed magnetic fields of the Orion A molecular cloud. The B∥ data were obtained by Tahani et al. (2018) and the B⊥ lines were observed by the Planck Space Observatory. The blue (red) circles show magnetic fields toward (away from) the observer, and the size of the circles represents the strength of the magnetic fields. The red and drapery lines show the B⊥ orientation. The background grayscale image is the visual extinction map obtained by Kainulainen et al. (2009). Tahani et al. (2019) suggested that an arc-shaped magnetic field morphology (as illustrated in the inset) is the most probable model that can explain the observed B∥ reversal across the cloud.
Current usage metrics show cumulative count of Article Views (full-text article views including HTML views, PDF and ePub downloads, according to the available data) and Abstracts Views on Vision4Press platform.
Data correspond to usage on the plateform after 2015. The current usage metrics is available 48-96 hours after online publication and is updated daily on week days.
Initial download of the metrics may take a while.


