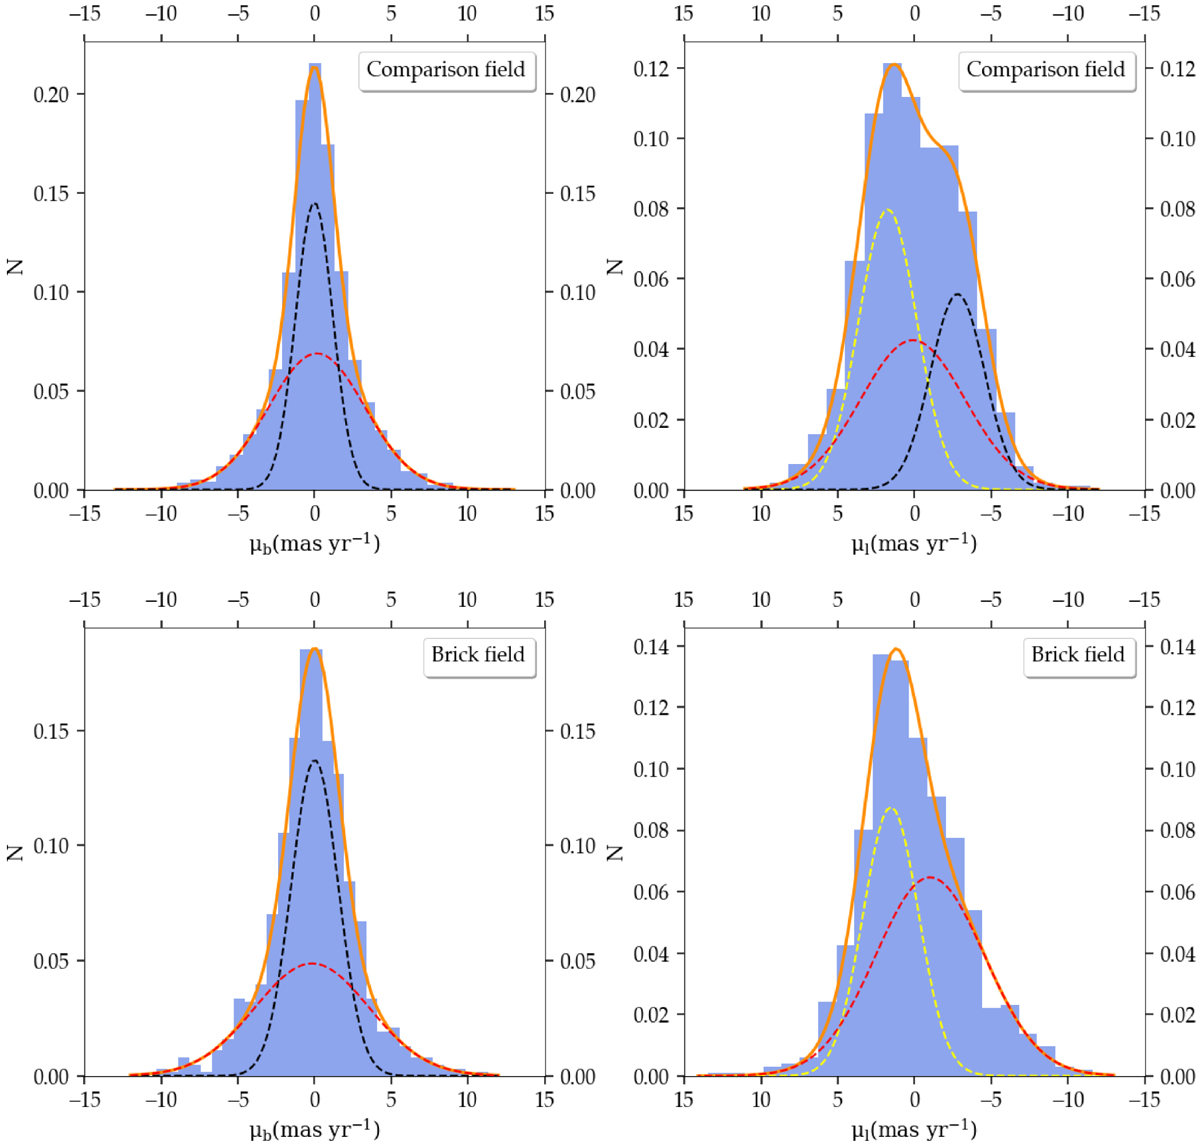
Fig. 4.
Download original image
Proper motion distribution for the comparison field (top row) and the Brick field (bottom row). Left-hand plots correspond to the perpendicular component, where the red Gaussian represents the Bulge stars and the black one corresponds to the NSD stars. Right-hand plots correspond to the parallel component, where the red Gaussian represents the Bulge stars and the yellow and black ones represent the NSD stars moving eastward and westward, respectively.
Current usage metrics show cumulative count of Article Views (full-text article views including HTML views, PDF and ePub downloads, according to the available data) and Abstracts Views on Vision4Press platform.
Data correspond to usage on the plateform after 2015. The current usage metrics is available 48-96 hours after online publication and is updated daily on week days.
Initial download of the metrics may take a while.