Fig. 4
Download original image
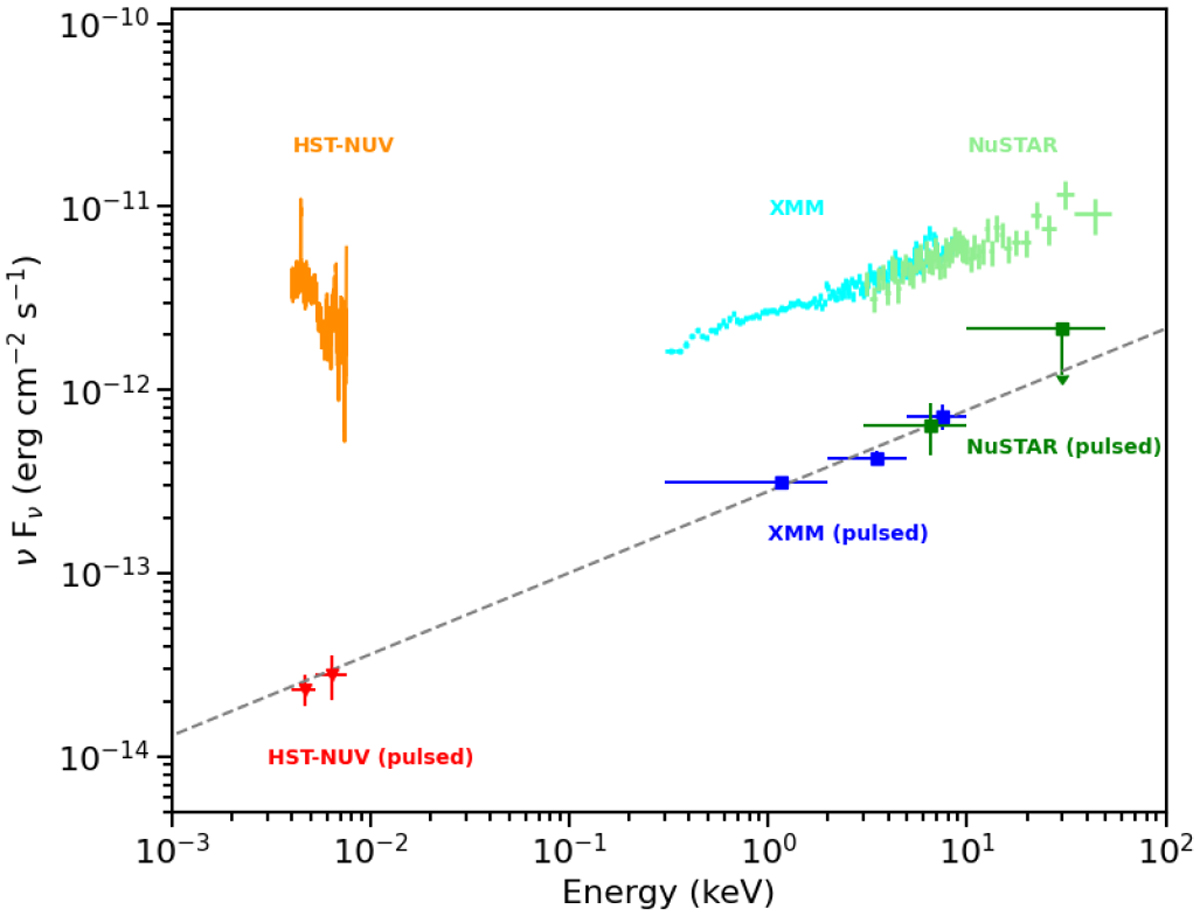
Unabsorbed SED from the near-UV to X-rays obtained using data collected simultaneously with HST, XMM-Newton, and NuSTAR during the 2021 simultaneous multi-wavelength campaign. The HST spectrum is plotted with an orange line and ranges from 165 to 310 nm. The average pulsed near-UV flux is plotted with red triangles over the 165–275 nm and 275–310 nm intervals. The total (pulsed plus un-pulsed) X-ray fluxes measured using XMM-Newton and NuSTAR are plotted using light blue and green points, respectively. The pulsed X-ray fluxes measured using XMM-Newton are computed over the 0.3–2, 2–5, and 5–10 keV energy bands and are plotted using blue squares. The pulsed X-ray fluxes measured using NuSTAR are computed over the 3–10 and 10–50 keV energy bands and are plotted using green squares. The upper limit in the 10–50 keV interval is marked by an arrow. The dashed grey line indicates the best fitting power-law model vFv ~ v0.4 that matches the pulsed near-UV and X-ray fluxes.
Current usage metrics show cumulative count of Article Views (full-text article views including HTML views, PDF and ePub downloads, according to the available data) and Abstracts Views on Vision4Press platform.
Data correspond to usage on the plateform after 2015. The current usage metrics is available 48-96 hours after online publication and is updated daily on week days.
Initial download of the metrics may take a while.