Fig. 2
Download original image
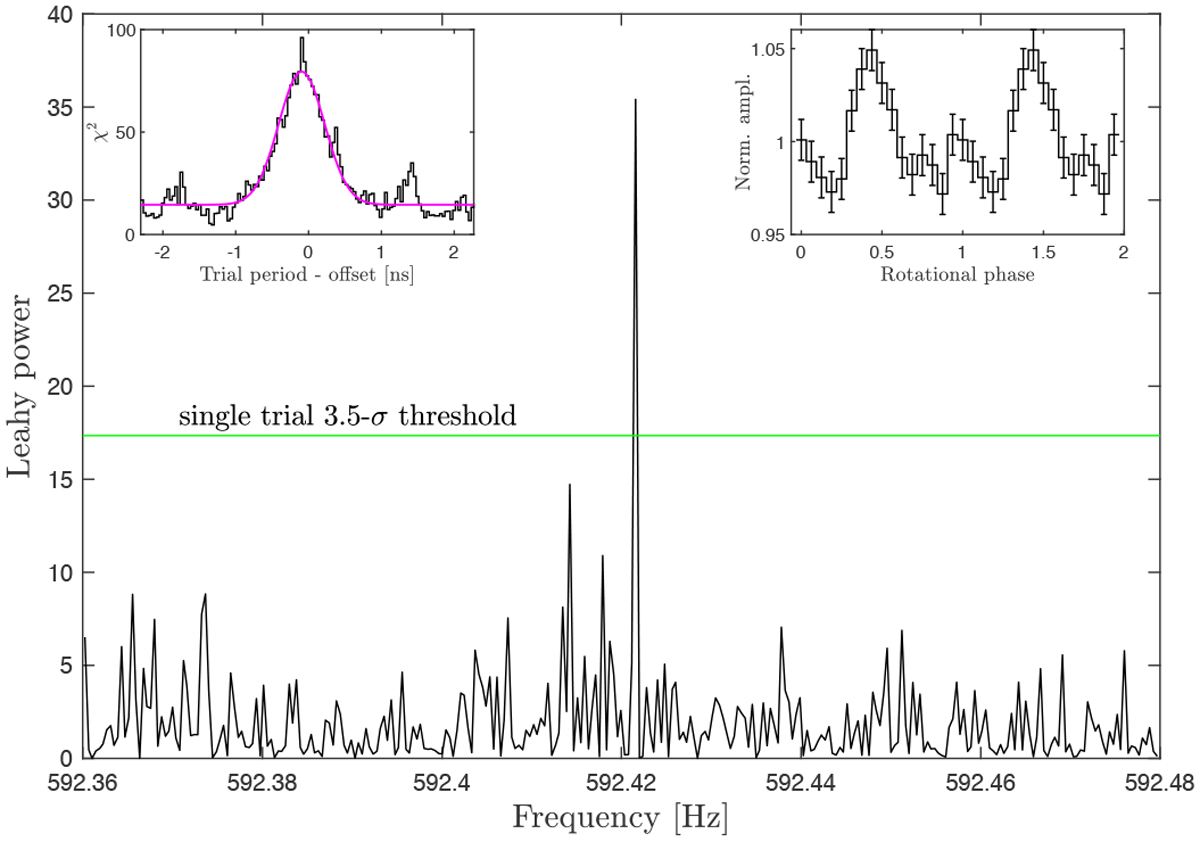
Fourier power spectral density of the 165–310 nm photons observed by STIS during the second orbit of the 2021 HST observations. Times of arrival are corrected using Tasc = 59 368.091163(33) MJD. The horizontal green line marks the detection power threshold at 3.5s single trial probability. The left inset plot shows the EFS with 128 trial periods conducted by sampling each period with 16 phase bins. The right inset plot shows the folded light curves using 16 phase bins per period. The time series is folded with the spin period of 1.687987321(69)ms.
Current usage metrics show cumulative count of Article Views (full-text article views including HTML views, PDF and ePub downloads, according to the available data) and Abstracts Views on Vision4Press platform.
Data correspond to usage on the plateform after 2015. The current usage metrics is available 48-96 hours after online publication and is updated daily on week days.
Initial download of the metrics may take a while.