Fig. 1
Download original image
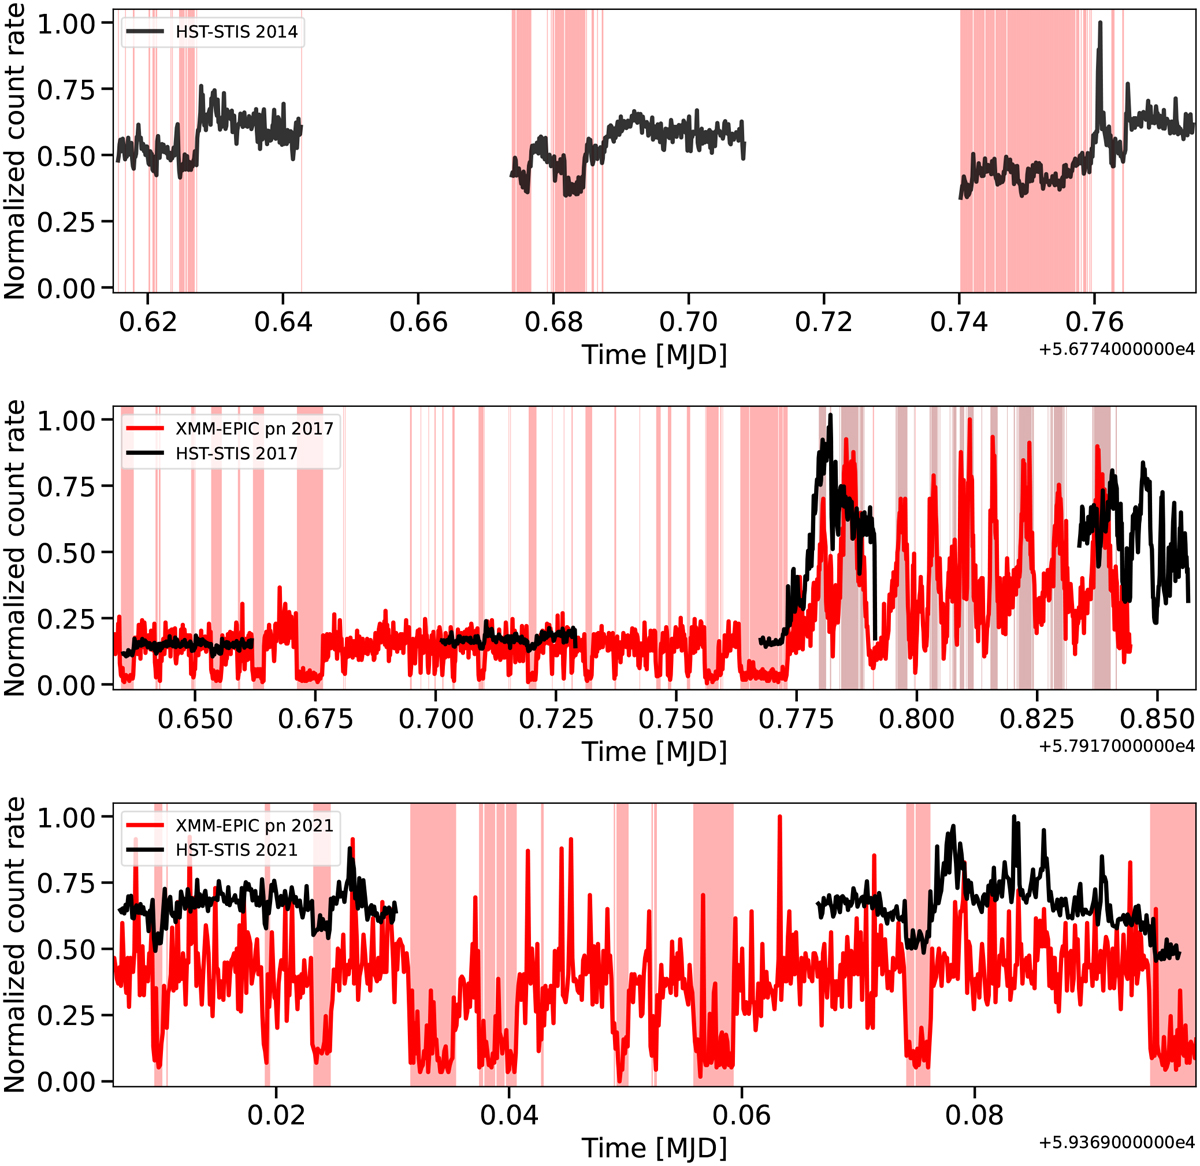
STIS and EPIC-pn light curves observed in 2014 (top panel), 2017 (central panel), and 2021 (bottom panel). Ultraviolet and X-ray light curves are binned every 10 s. The count rate is normalised for each instrument at the maximum count rate. The vertical regions indicate the high (white), low (light red), and flaring (dark red) X-ray modes.
Current usage metrics show cumulative count of Article Views (full-text article views including HTML views, PDF and ePub downloads, according to the available data) and Abstracts Views on Vision4Press platform.
Data correspond to usage on the plateform after 2015. The current usage metrics is available 48-96 hours after online publication and is updated daily on week days.
Initial download of the metrics may take a while.