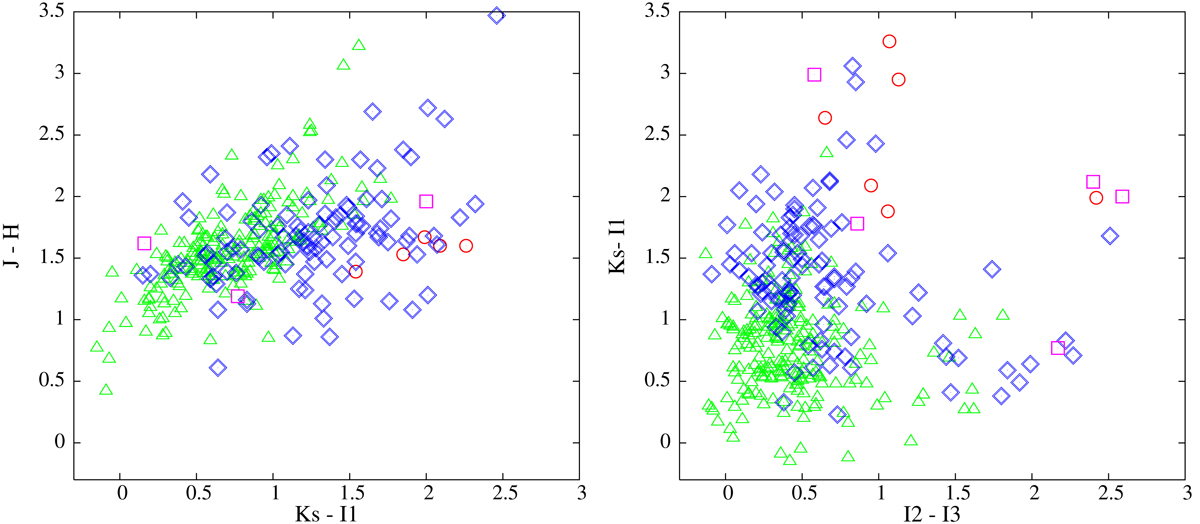
Fig. 4.
Download original image
Color-color diagrams of all the YSOs identified in the fields of both DR 18 and ECX 6-21. The two examples shown here are respectively dominated by the effects of extinction (KS − I1, J − H) and circumstellar excess (I2 − I3, KS − I1). Red circles are Class I sources, blue diamonds Class II sources, green triangles transitional sources, and magenta squares Flat Spectrum sources. Sources of the same type tend to cluster on specific regions of each diagram, which nevertheless overlap due to our simultaneous use of all the available photometry to derive the spectral index, n, on which our classification is based.
Current usage metrics show cumulative count of Article Views (full-text article views including HTML views, PDF and ePub downloads, according to the available data) and Abstracts Views on Vision4Press platform.
Data correspond to usage on the plateform after 2015. The current usage metrics is available 48-96 hours after online publication and is updated daily on week days.
Initial download of the metrics may take a while.