Fig. 6.
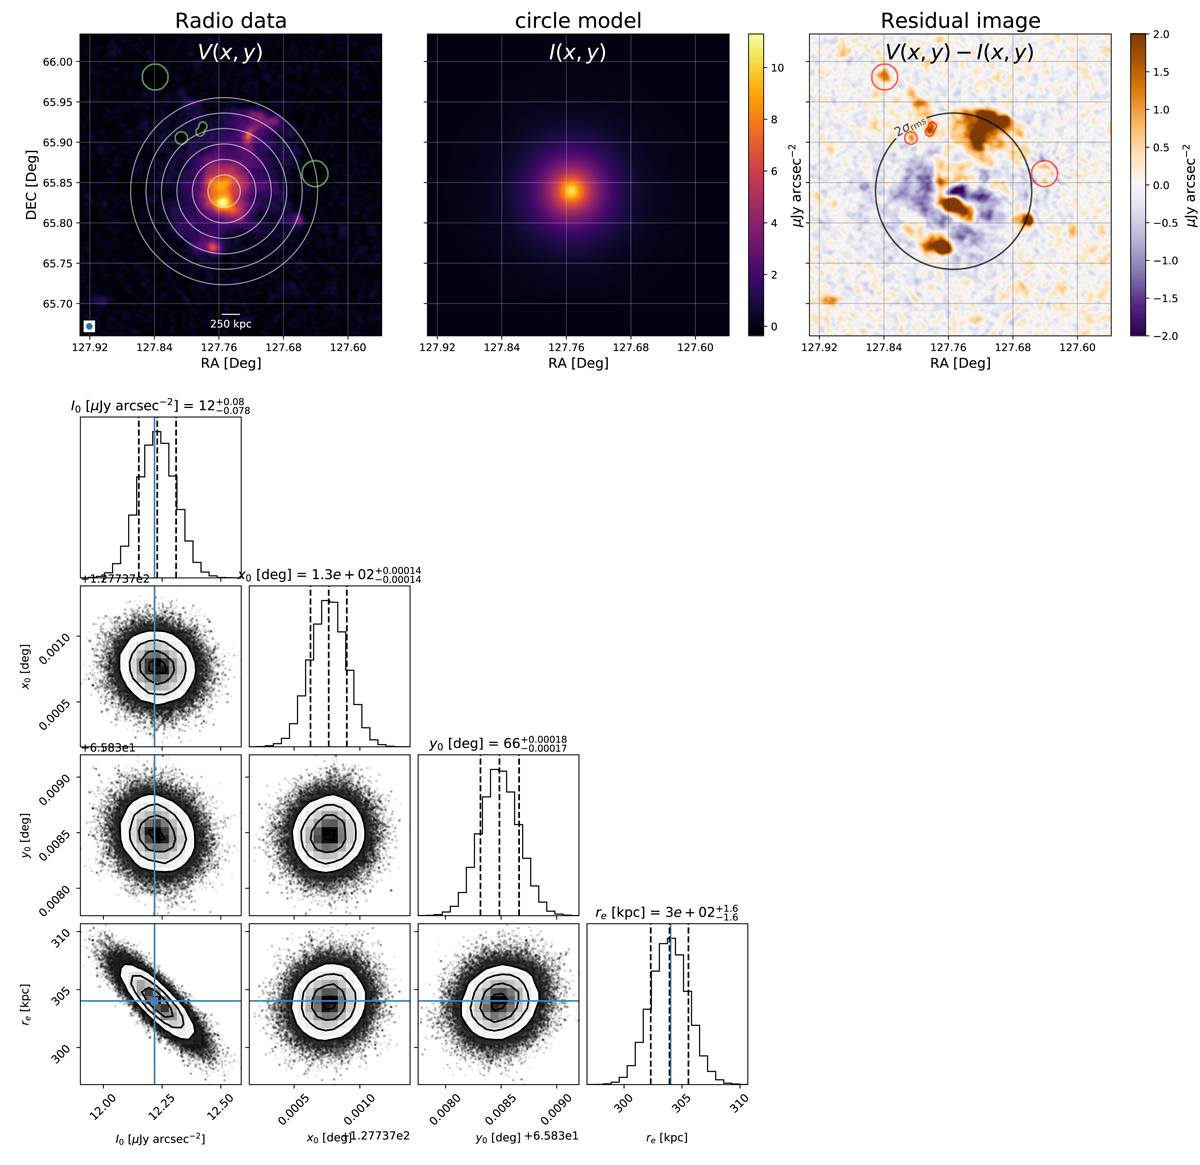
Download original image
Results obtained by fitting the radio halo shown in Fig. 3 with HALO-FDCA (Boxelaar et al. 2021). Top figures: image used for the fit with overlaid: the contours (white circles) of the best-fit circular model drawn at [1, 2, 4, 8, …] × σ (left panel), the image of the best-fit model (central panel), and the residual image of the fit, with the 2σ model contour denoted by the black circle (right panel). Contaminating sources are masked out and are highlighted by the green and red regions (left and right panels, respectively). Bottom figure: MCMC corner plot presenting the distribution of the posteriors of each fitted parameter (Foreman-Mackey et al. 2013).
Current usage metrics show cumulative count of Article Views (full-text article views including HTML views, PDF and ePub downloads, according to the available data) and Abstracts Views on Vision4Press platform.
Data correspond to usage on the plateform after 2015. The current usage metrics is available 48-96 hours after online publication and is updated daily on week days.
Initial download of the metrics may take a while.