Fig. 3.
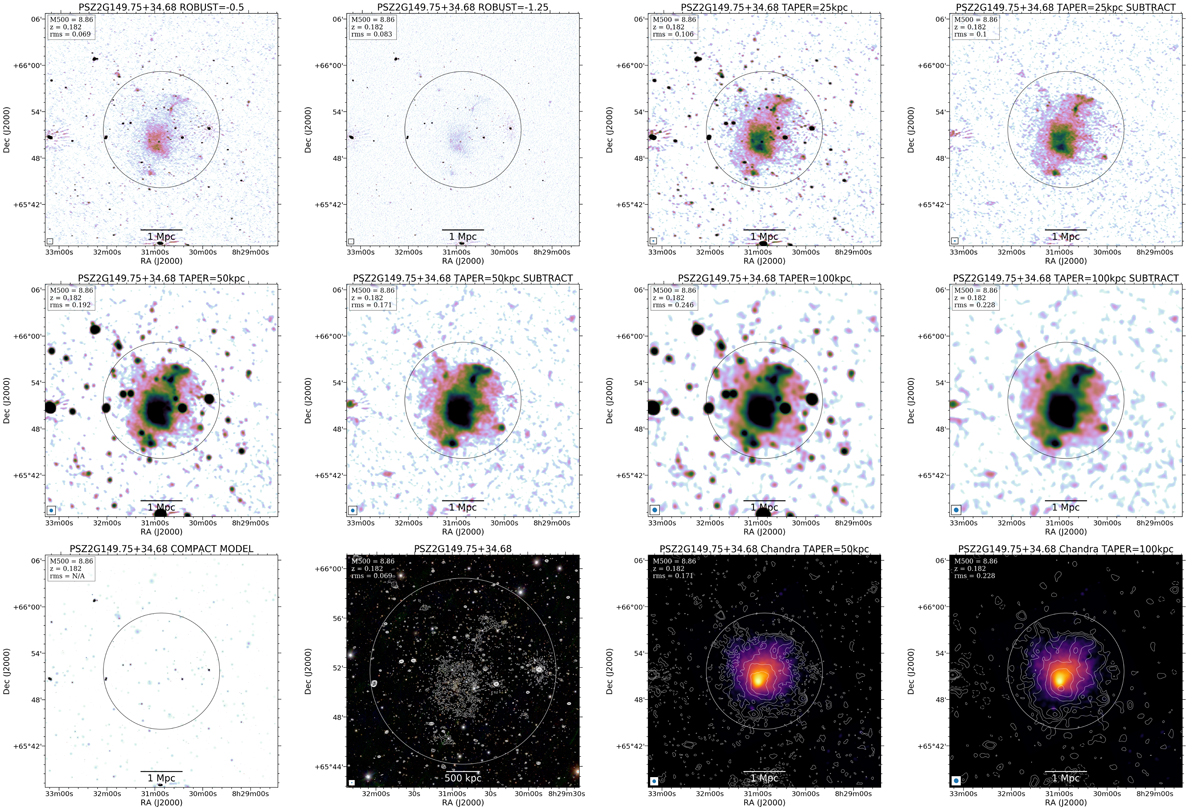
Download original image
Example of the set of images that we produced for each object in our sample. The displayed cluster is PSZ2 G149.75+34.68, and the reported panels show (from left to right and from top to bottom) the reference image (robust = −0.5), the high-resolution image (robust = −1.25), taper 25, 50, and 100 kpc images with and without discrete sources, the clean model components used for the source subtraction, contours from the reference radio image starting from 3σ overlaid on an optical image (Pan-STARRS g, r, i), and taper 50 and 100 kpc discrete-source-subtracted contours starting from 2σ overlaid on an X-ray image (Chandra or XMM-Newton). Contours are always spaced by a factor of 2. The beam is shown in the bottom-left corner, and the mass (M500, in ×1014 M⊙ units), redshift (z), and image noise (rms, in mJy beam−1 units) are reported in the top-left corner. The circle denotes r500 and is centered at the coordinates reported in the PSZ2 catalog. The images are available at full resolution as well as in FITS format on the project website (https://lofar-surveys.org/planck_dr2.html).
Current usage metrics show cumulative count of Article Views (full-text article views including HTML views, PDF and ePub downloads, according to the available data) and Abstracts Views on Vision4Press platform.
Data correspond to usage on the plateform after 2015. The current usage metrics is available 48-96 hours after online publication and is updated daily on week days.
Initial download of the metrics may take a while.