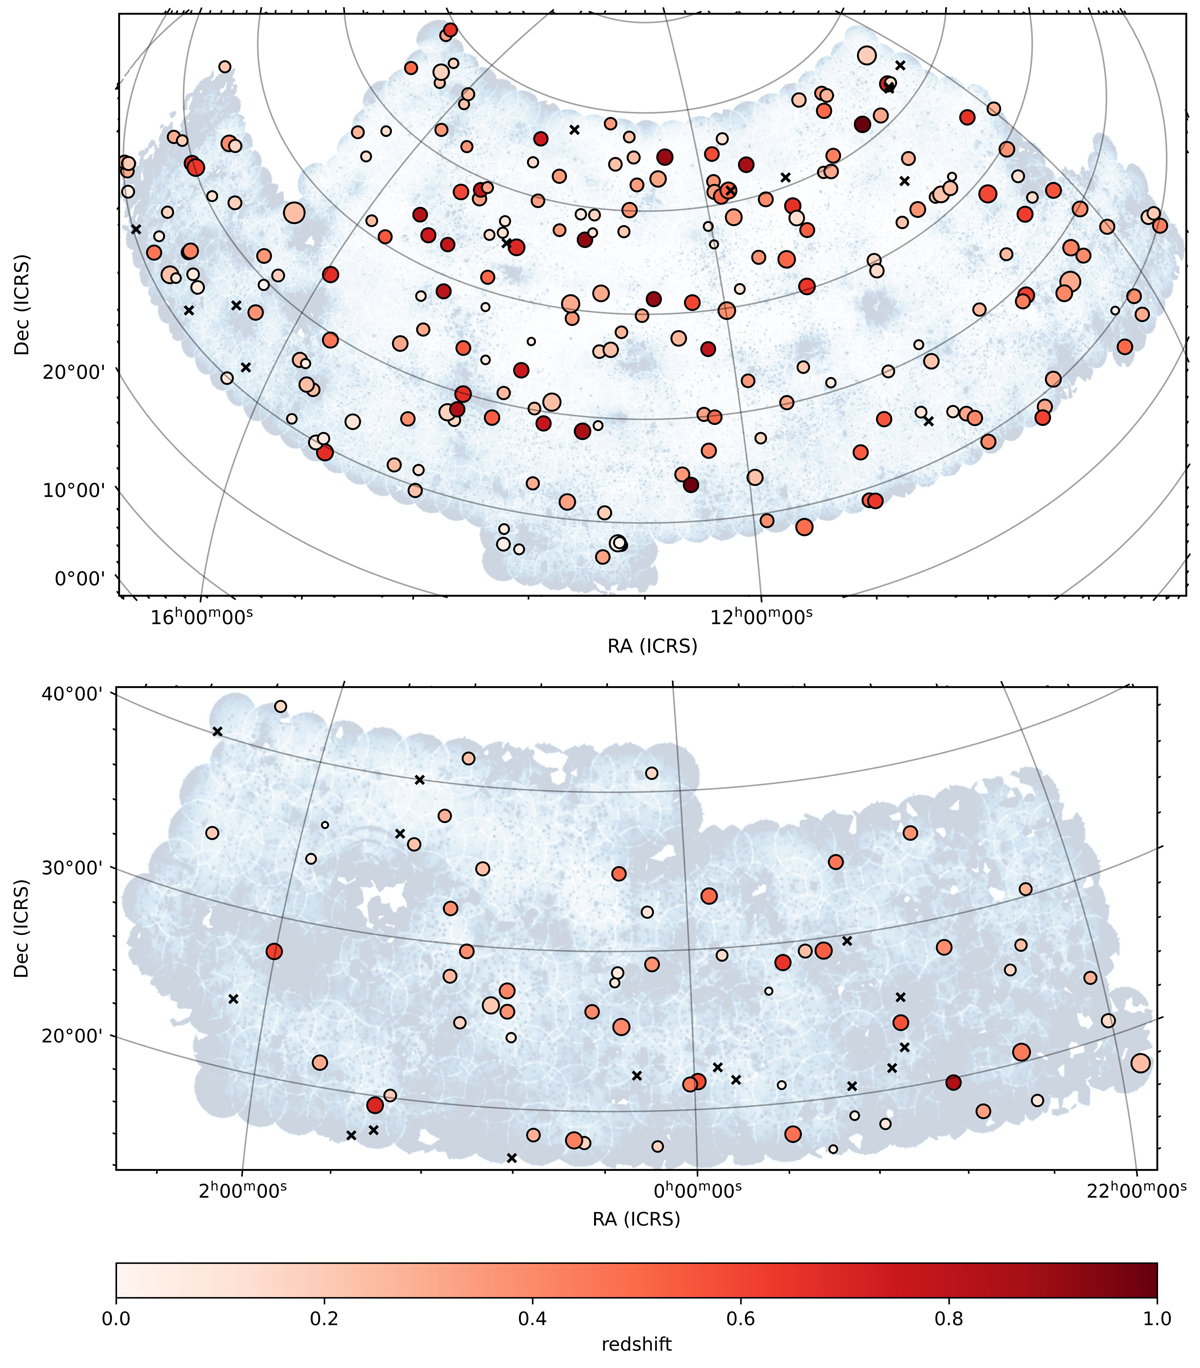
Fig. 2.
Download original image
Position of the PSZ2 clusters in the RA-13 (top) and RA-1 (bottom) regions covered by LoTSS-DR2. The color code indicates the redshift of the cluster. The radius of the circle is proportional to M500. Clusters without redshift and mass are reported as black crosses. The background image represents the noise variations in LoTSS-DR2 (darker colors denote higher noise values) and is reproduced from Shimwell et al. (2022).
Current usage metrics show cumulative count of Article Views (full-text article views including HTML views, PDF and ePub downloads, according to the available data) and Abstracts Views on Vision4Press platform.
Data correspond to usage on the plateform after 2015. The current usage metrics is available 48-96 hours after online publication and is updated daily on week days.
Initial download of the metrics may take a while.