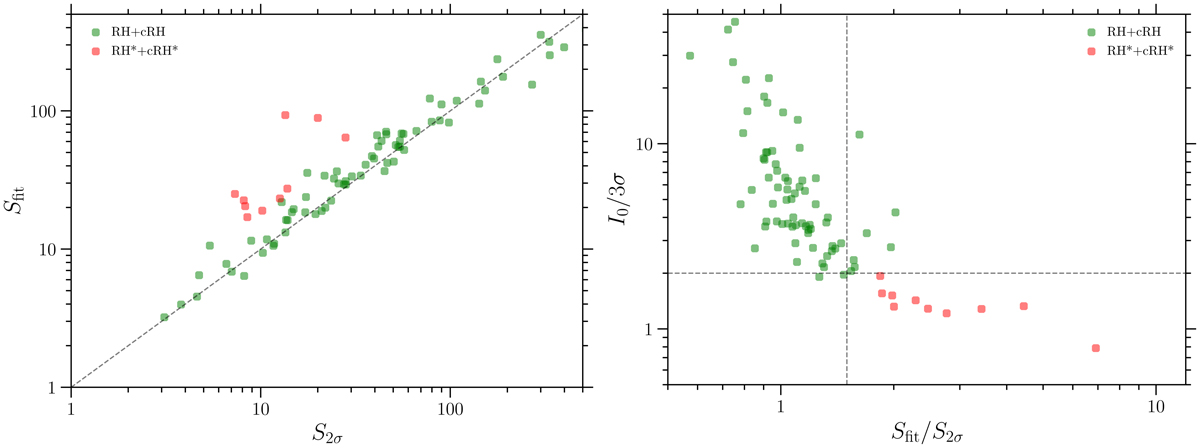
Fig. C.1.
Download original image
Flux density measurements for radio halos. Left: Comparison between the flux density derived with HALO-FDCA (Sfit) and that obtained manually within the 2σ contour (S2σ). The dashed line indicates the linear correlation as a reference. Right: Diagnostic plot used to determine when HALO-FDCA does not provide a reliable flux density measurement due to the low significance of the radio halo. The dashed lines indicate the thresholds of Sfit/S2σ > 1.5 and I0/3σ < 2 that were used to identify the sources that were classified as radio halos or candidate radio halos with the decision tree of Fig. 4, but whose flux density was not considered reliable. These sources are reported in red and in the manuscript are referred to as RH* and cRH*.
Current usage metrics show cumulative count of Article Views (full-text article views including HTML views, PDF and ePub downloads, according to the available data) and Abstracts Views on Vision4Press platform.
Data correspond to usage on the plateform after 2015. The current usage metrics is available 48-96 hours after online publication and is updated daily on week days.
Initial download of the metrics may take a while.