Fig. 1.
Download original image
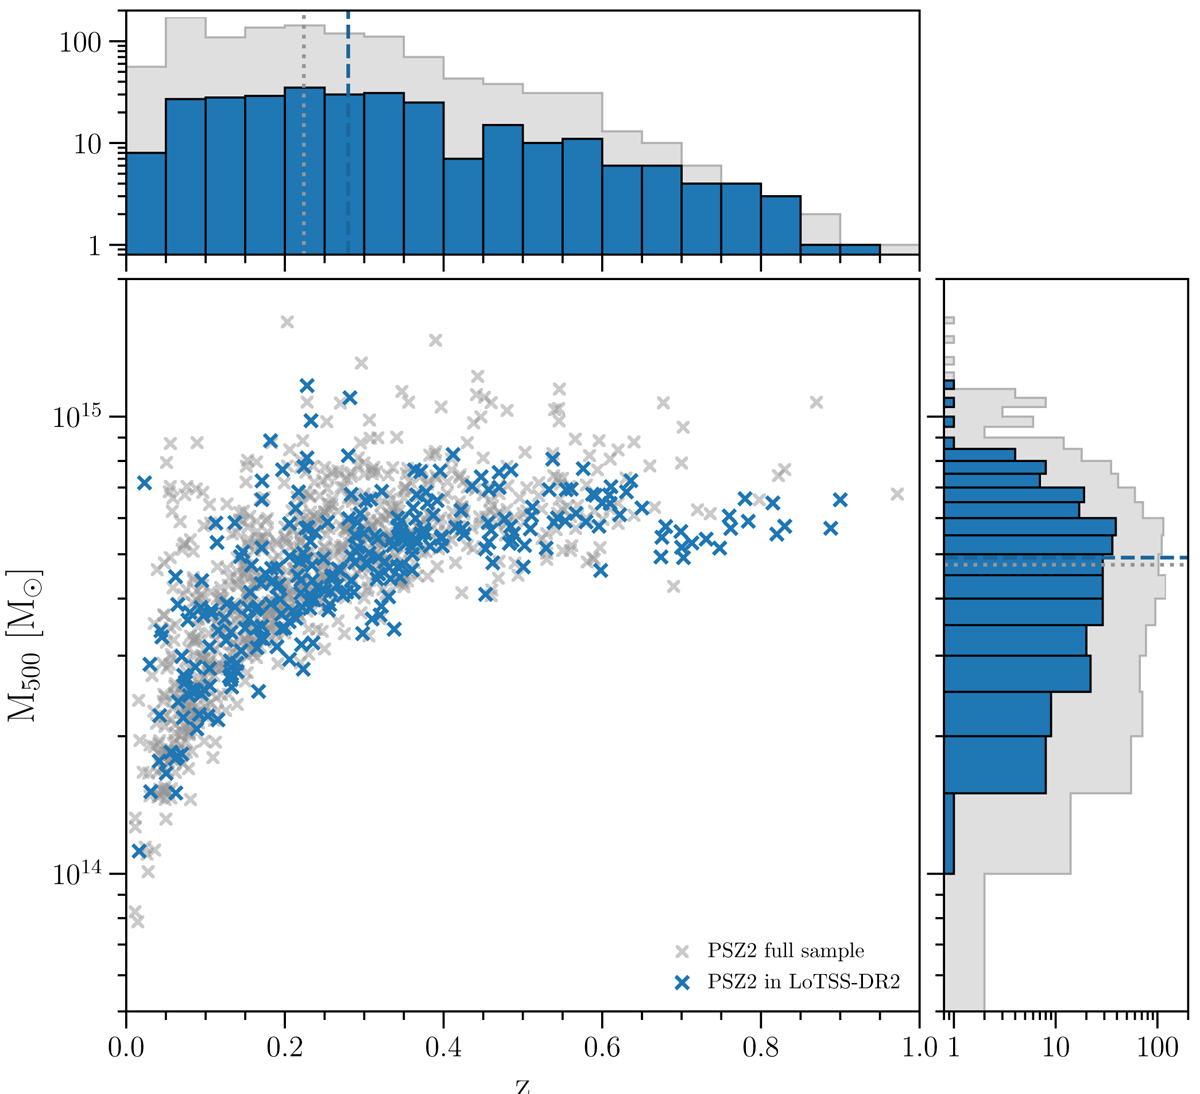
Redshift-mass distribution of PSZ2 sources. Clusters that are located in the LoTSS-DR2 area are indicated in blue. The histograms show the number of clusters at various redshifts and masses; the dashed and dotted lines mark the median values of the LoTSS-DR2 sample and the full PSZ2 sample, respectively. Similarly to the full PSZ2 sample, our sample spans a wide range of redshifts and masses.
Current usage metrics show cumulative count of Article Views (full-text article views including HTML views, PDF and ePub downloads, according to the available data) and Abstracts Views on Vision4Press platform.
Data correspond to usage on the plateform after 2015. The current usage metrics is available 48-96 hours after online publication and is updated daily on week days.
Initial download of the metrics may take a while.