Fig. 3
Download original image
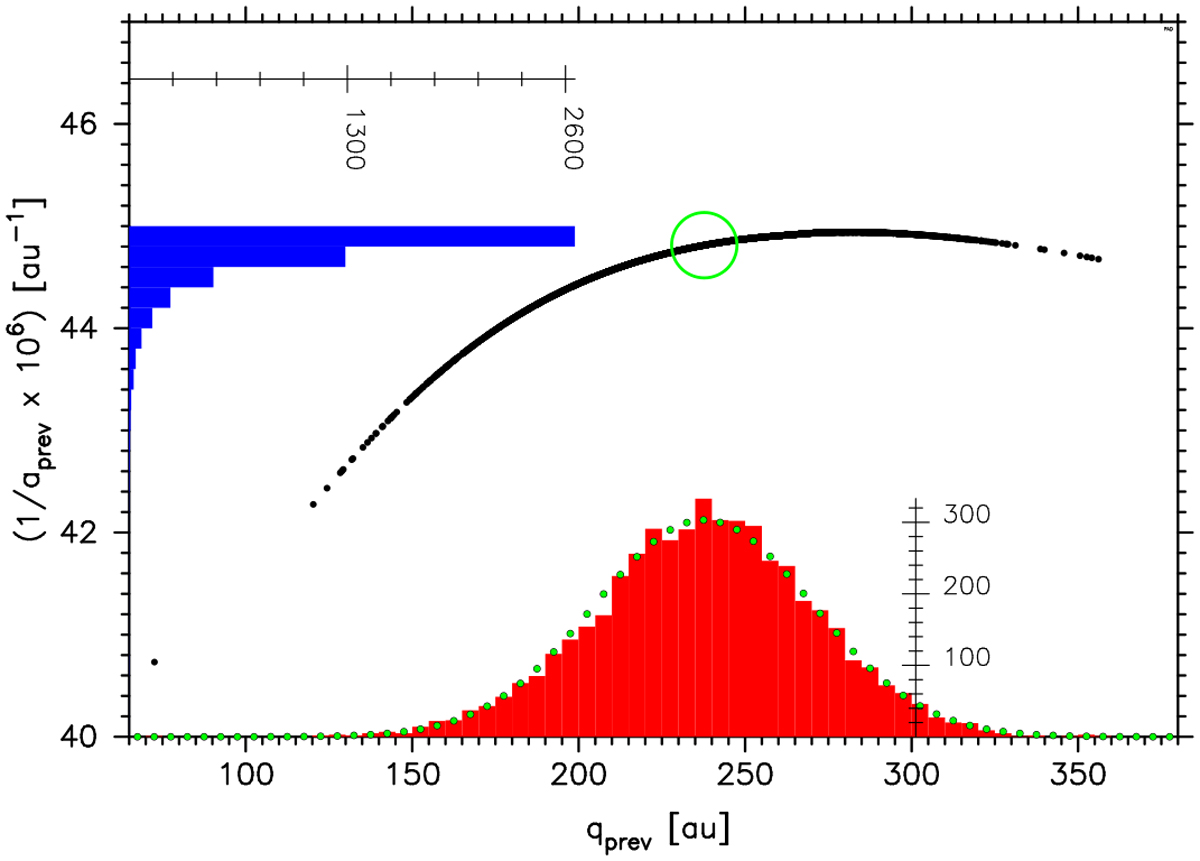
Influence of BB orbit uncertainty on parameters of the previous orbit. black dots show the results of the backward numerical integration of 5001 clones of BB stopped at the previous perihelion with all Galactic and stellar perturbations included. The center of the green circle marks the nominal result. The red histogram presents a marginal distribution of qprev along with the best Gaussian approximation (green dots in the middle of each bar). The blue histogram is a marginal distribution of 1/aprev.
Current usage metrics show cumulative count of Article Views (full-text article views including HTML views, PDF and ePub downloads, according to the available data) and Abstracts Views on Vision4Press platform.
Data correspond to usage on the plateform after 2015. The current usage metrics is available 48-96 hours after online publication and is updated daily on week days.
Initial download of the metrics may take a while.