Fig. 5.
Download original image
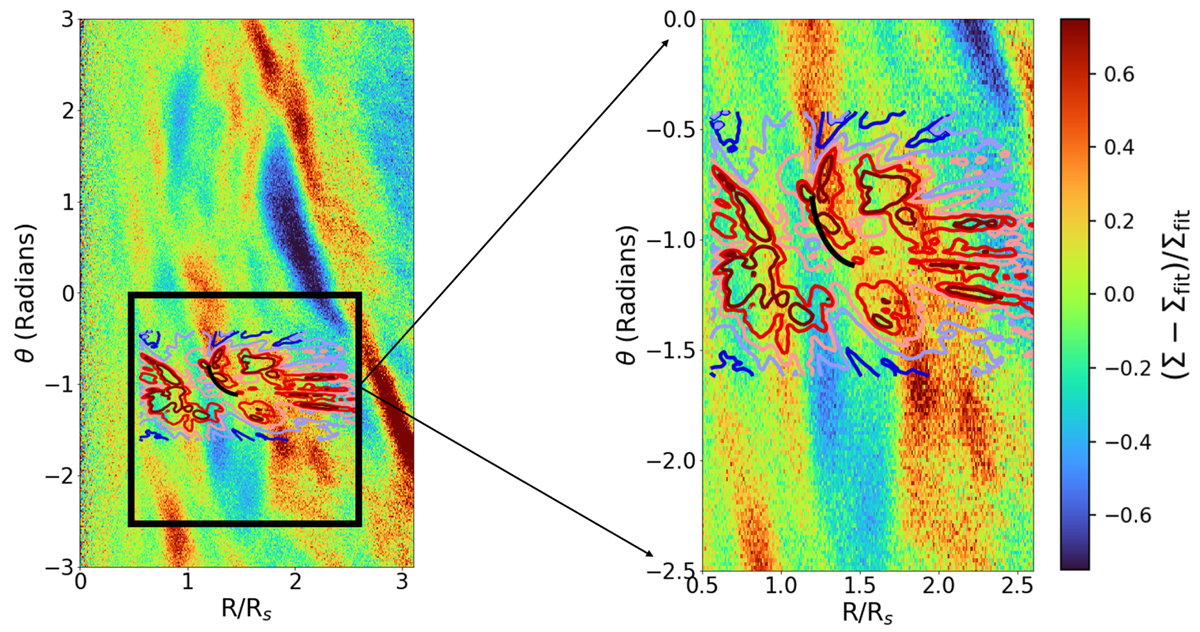
Overdensity contours of UMS data along with the Radcliffe wave (black curve) overlapped with the simulation of a satellite galaxy perturbing the disk. The residual features are observed after t = 0.6 Gyr of satellite punching the disk.The surface density residuals are computed as Σ − Σfit/Σfit and displayed in polar coordinates.
Current usage metrics show cumulative count of Article Views (full-text article views including HTML views, PDF and ePub downloads, according to the available data) and Abstracts Views on Vision4Press platform.
Data correspond to usage on the plateform after 2015. The current usage metrics is available 48-96 hours after online publication and is updated daily on week days.
Initial download of the metrics may take a while.