Fig. 3.
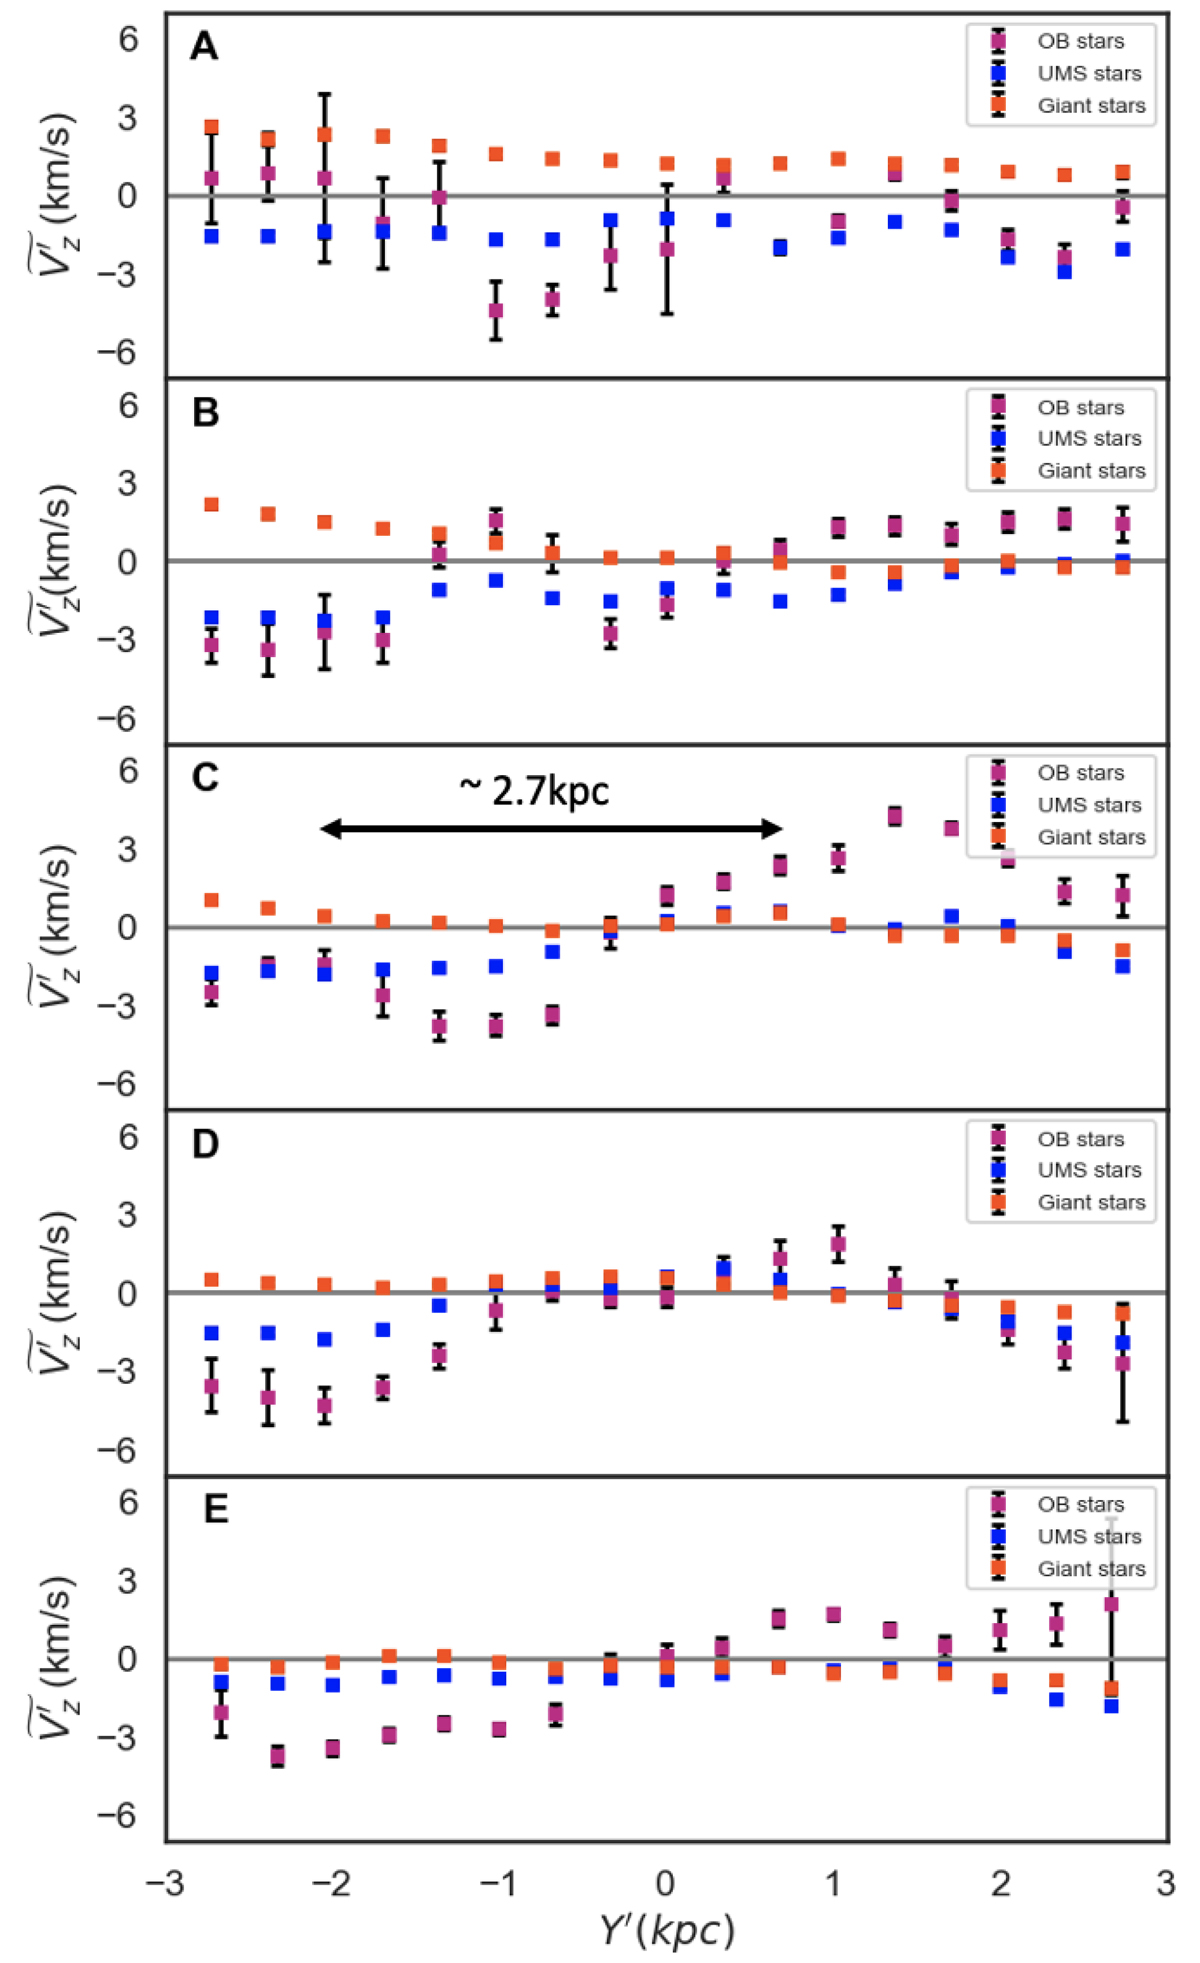
Download original image
Age gradient in the oscillation of stars with the OB stars (youngest) showing a larger amplitude of oscillation in the kinematics. Each plot from top to bottom corresponds to the panels A to E as shown in the bottom row of Fig. 2. Here, Y′ is the coordinate along the Radcliffe wave, as explained in the text. The solid black lines correspond to the bootstrap uncertainties of ![]() .
.
Current usage metrics show cumulative count of Article Views (full-text article views including HTML views, PDF and ePub downloads, according to the available data) and Abstracts Views on Vision4Press platform.
Data correspond to usage on the plateform after 2015. The current usage metrics is available 48-96 hours after online publication and is updated daily on week days.
Initial download of the metrics may take a while.